Designing for clarity in lab automation
A new lab automation system put a display at every module, not just the central controller. I defined what operators need where, what comes first, and how the system tells them when to act.
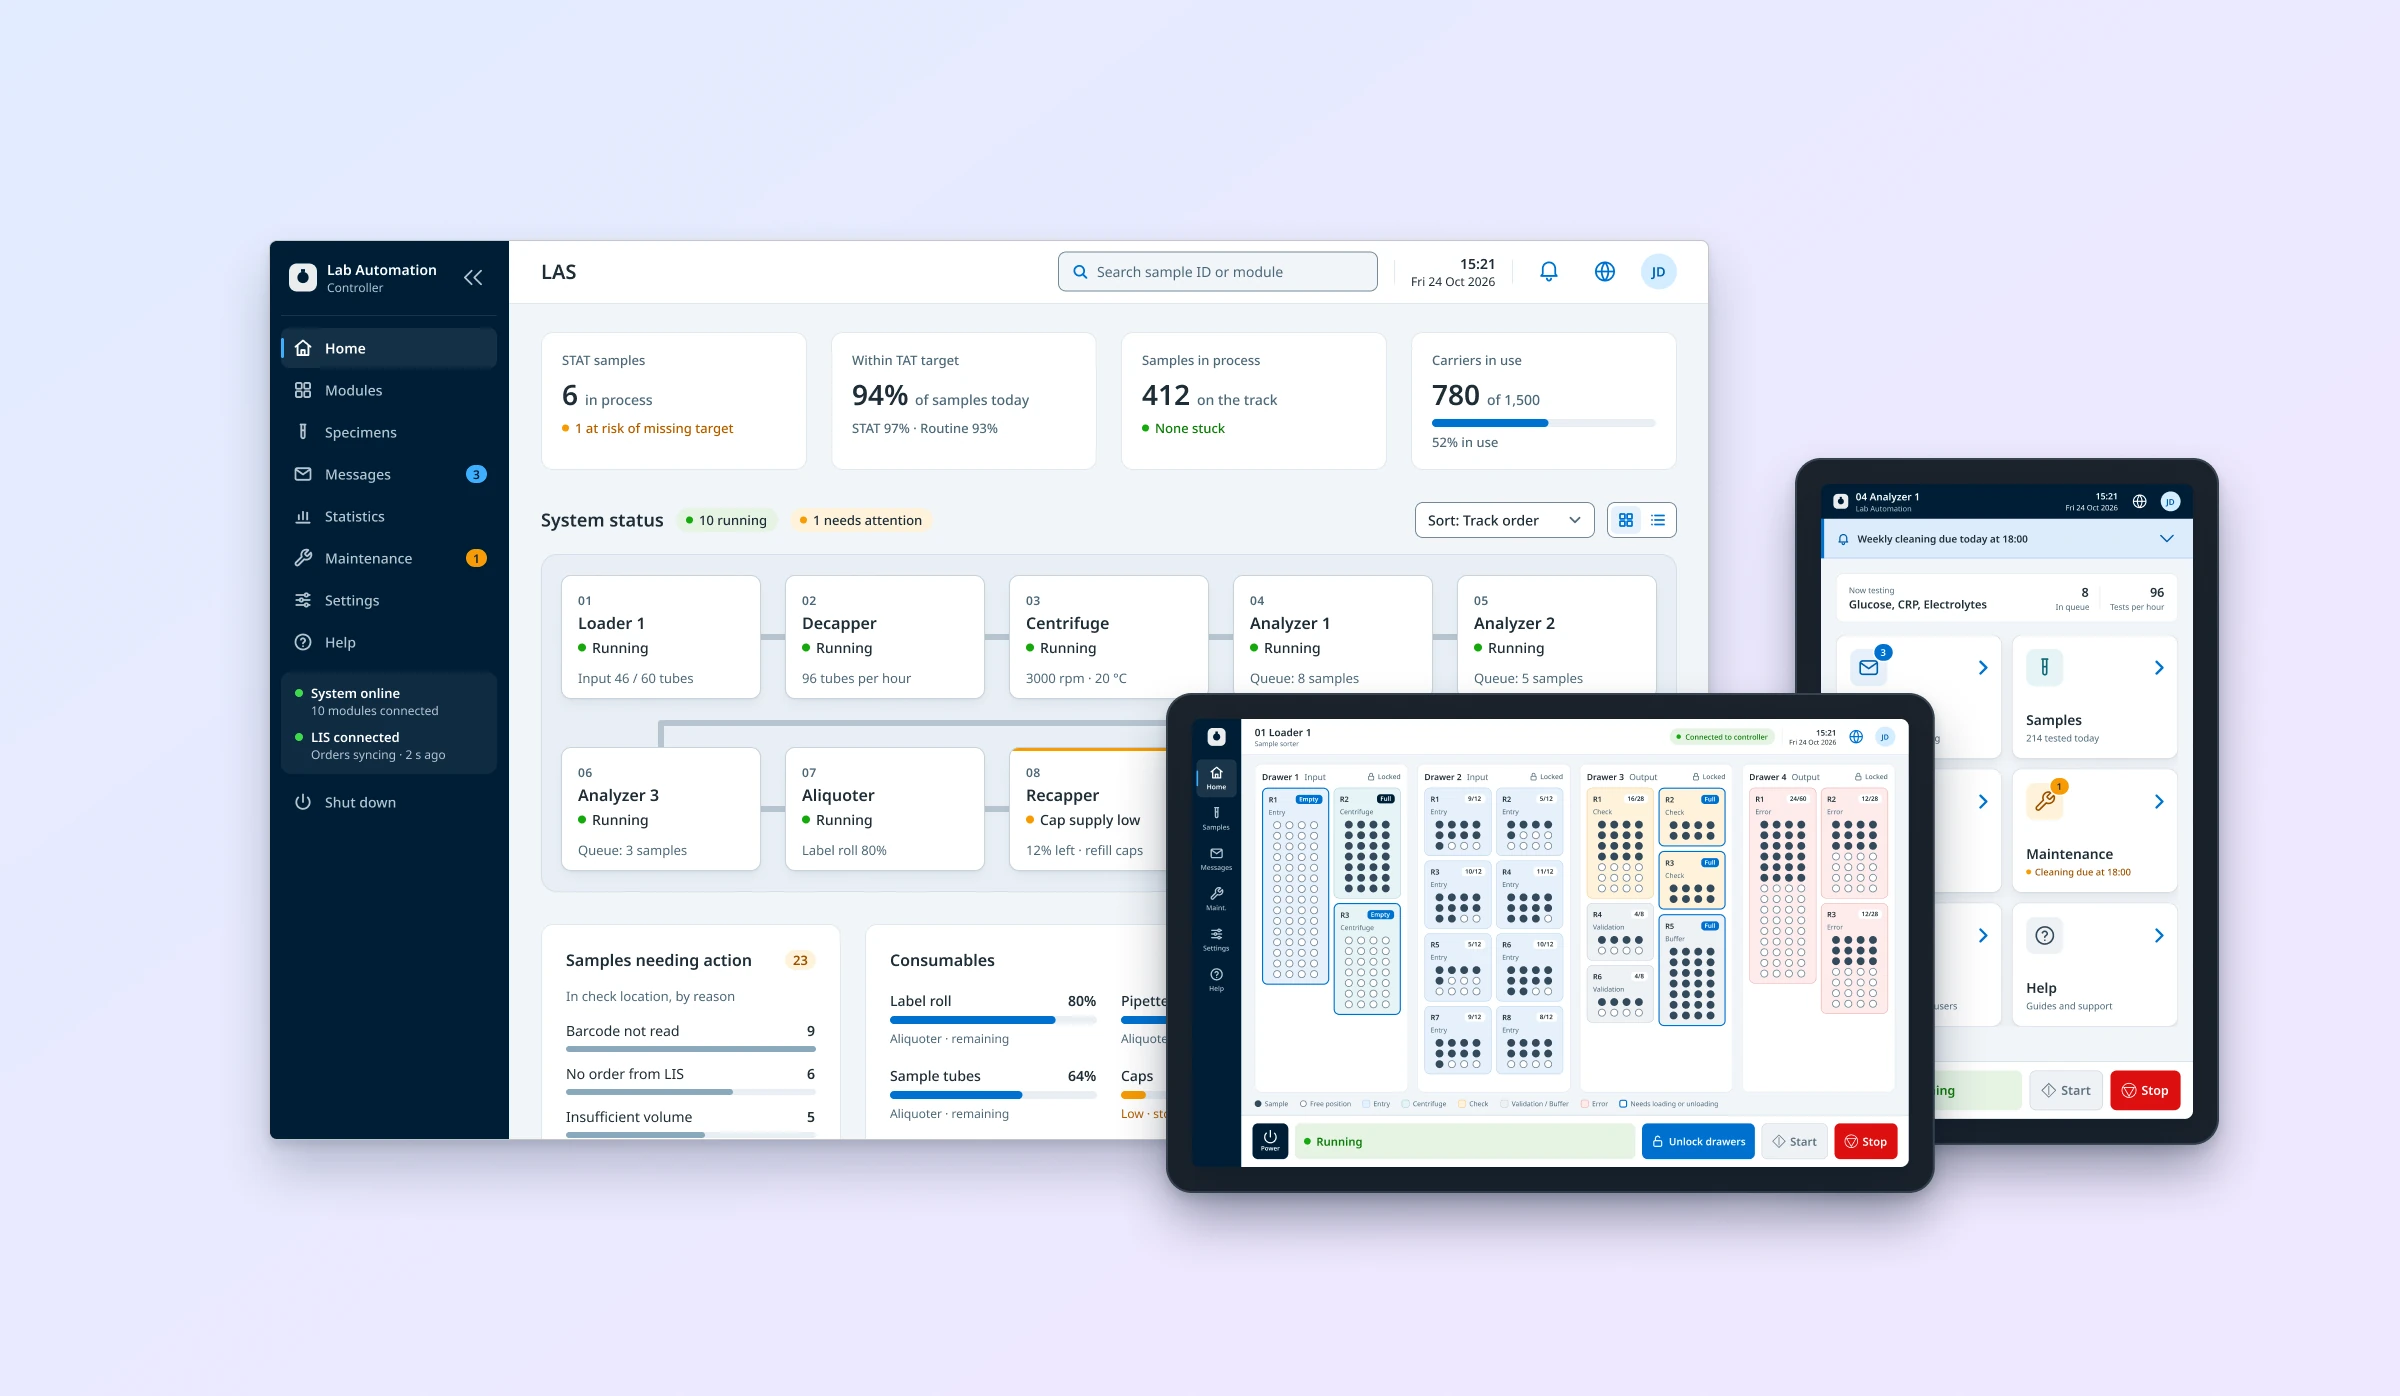
Screens on this page are reconstructions made for this portfolio, not original product screens.
Eight applications, complex equipment behaviour and a small team.
Owned UX scope and schedule end to end. Designed the product from scratch, built the design system alongside it, and set the information hierarchy with engineering.
A product roadmap, two desktop apps and six module displays, all tested on real equipment.
Context
A global life sciences company was building a new automation system for clinical labs: instruments and modules connected by a physical sample track.
The previous system ran from one central controller. The new one also put a display on every module. That turned a screen-design problem into a system question: which information and actions belong where.
I owned UX and UI across eight applications: the controller desktop app, a service and maintenance tool for field engineers and manufacturing, and six embedded module displays. The work ran from research and workflow definition through prototyping to implementation support.
The system served four user groups: operators running samples on every shift, admins, lab managers, and field service engineers who install and maintain the equipment.
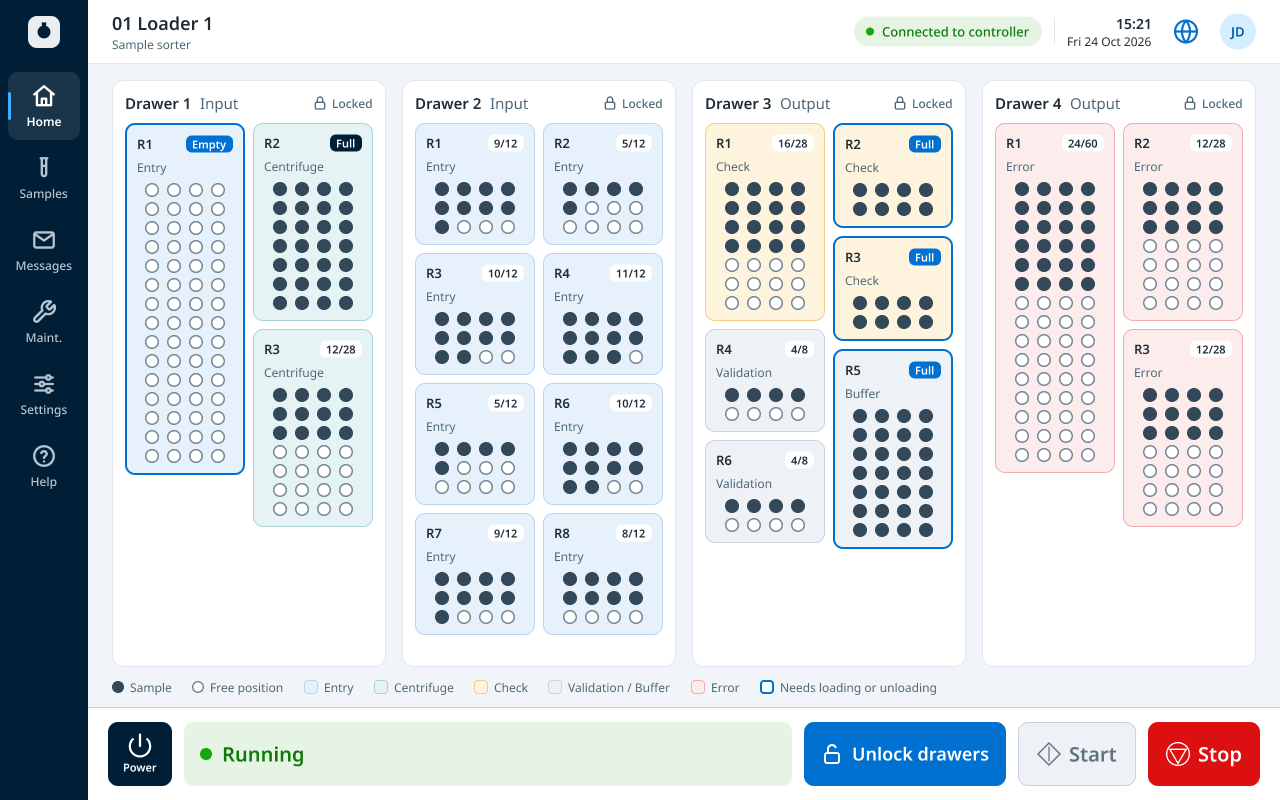
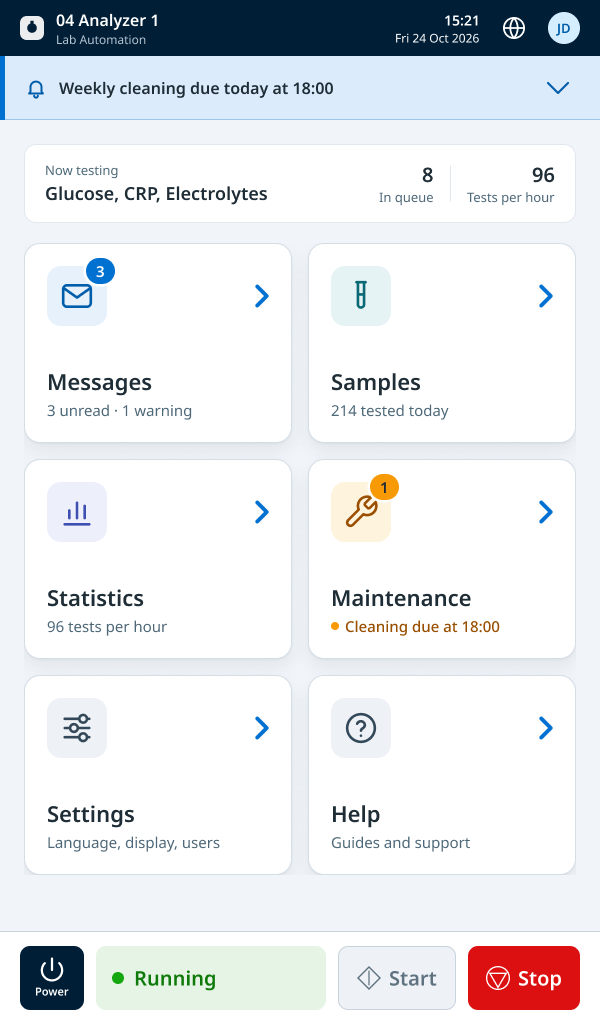
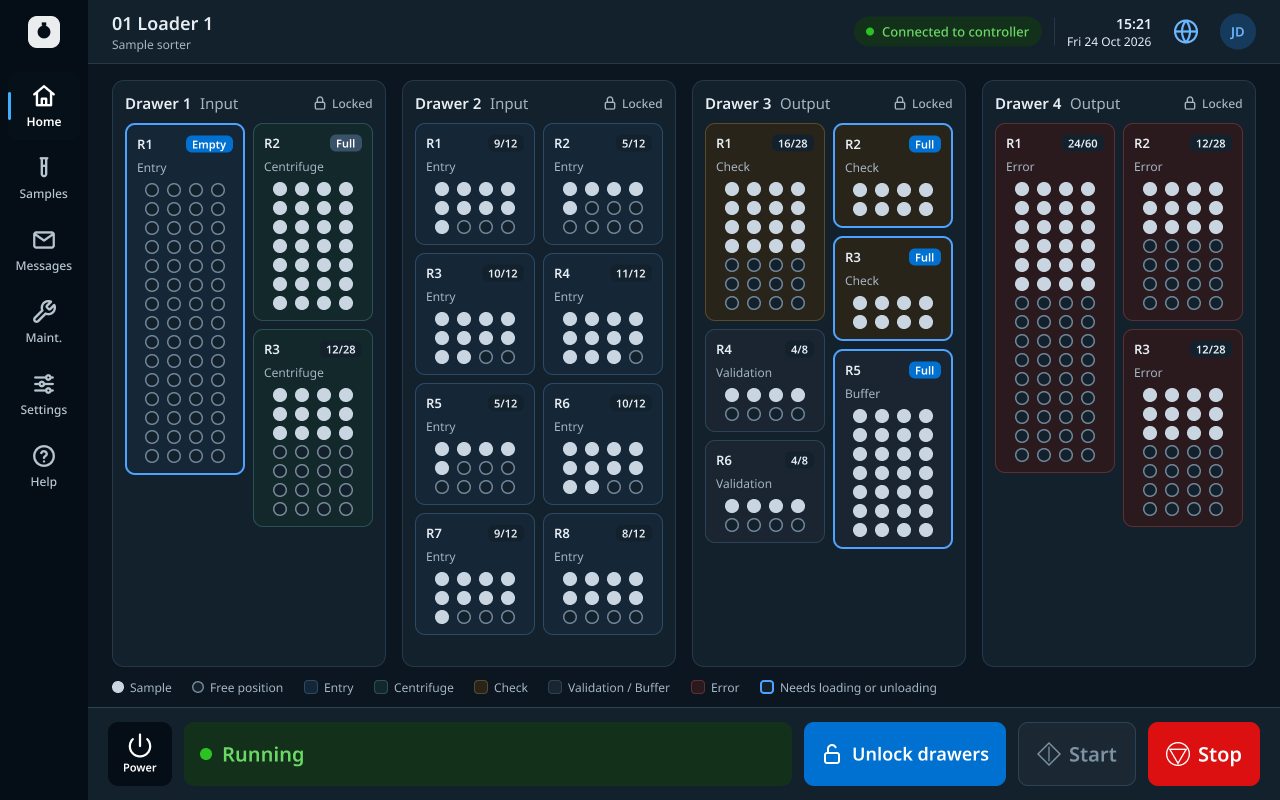
This case focuses on the controller, the sample sorter and the analyser interface module. I also designed the decapper, recapper, centrifuge and buffer displays, and the service tool that engineers install on their own computers to configure the system. All of them share one design system.
The problem
Which information and actions belong at the central controller, and which are needed beside the equipment?
Any answer had to hold up under three constraints. The equipment behaves in complex ways, from sample histories to operating sequences. Good ideas outnumbered a small team. And because the software drives hardware, a missed or misread fault has physical consequences.
We started on the lab floor. We visited three labs in Sweden, Italy and Finland, most running 24/7, observed operators through real shifts and held 12 in-depth interviews. An online survey reached the sites we couldn’t visit, with over 80 responses.
Lab culture differs by region, down to how a lab should sound. Labs in Northern Europe wanted quiet alarms, with sound operators can switch on and off. Several labs in Italy wanted the opposite: more sound, with each module recognisable by ear. No single default would suit every lab.
What lives where
Controller
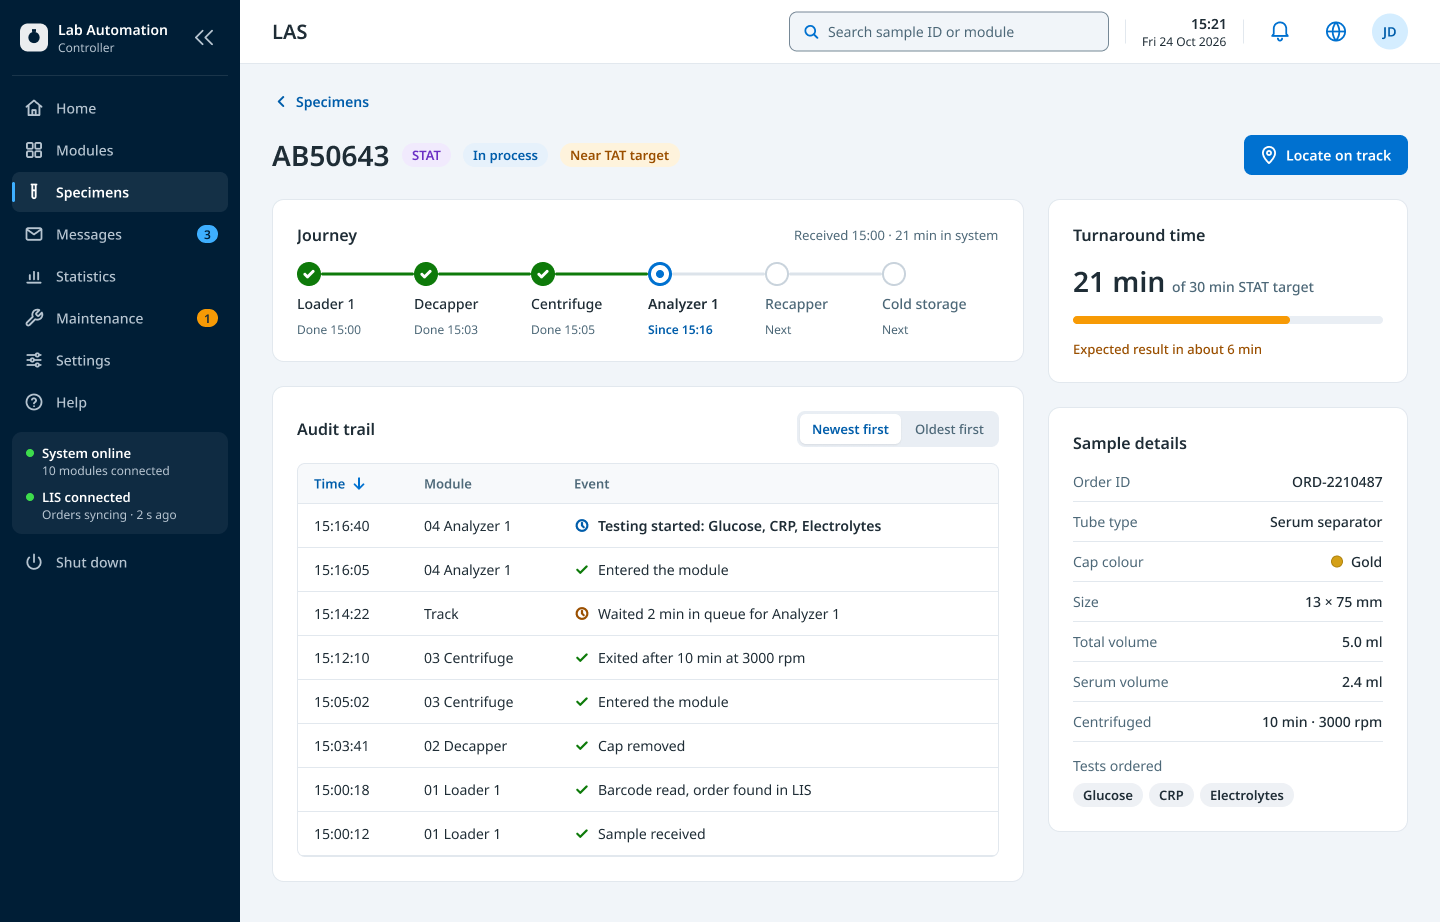
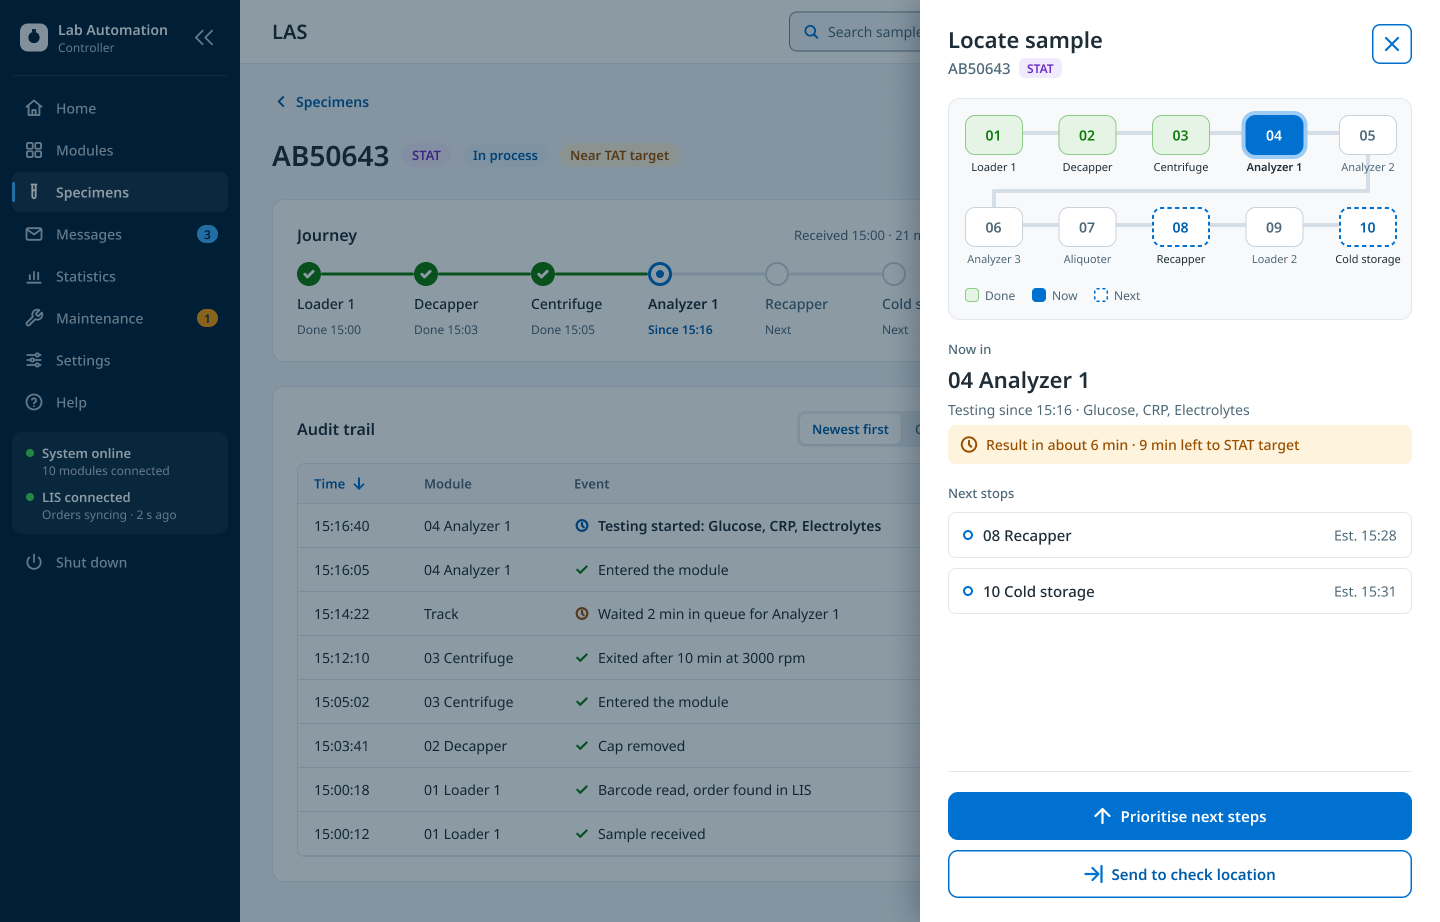
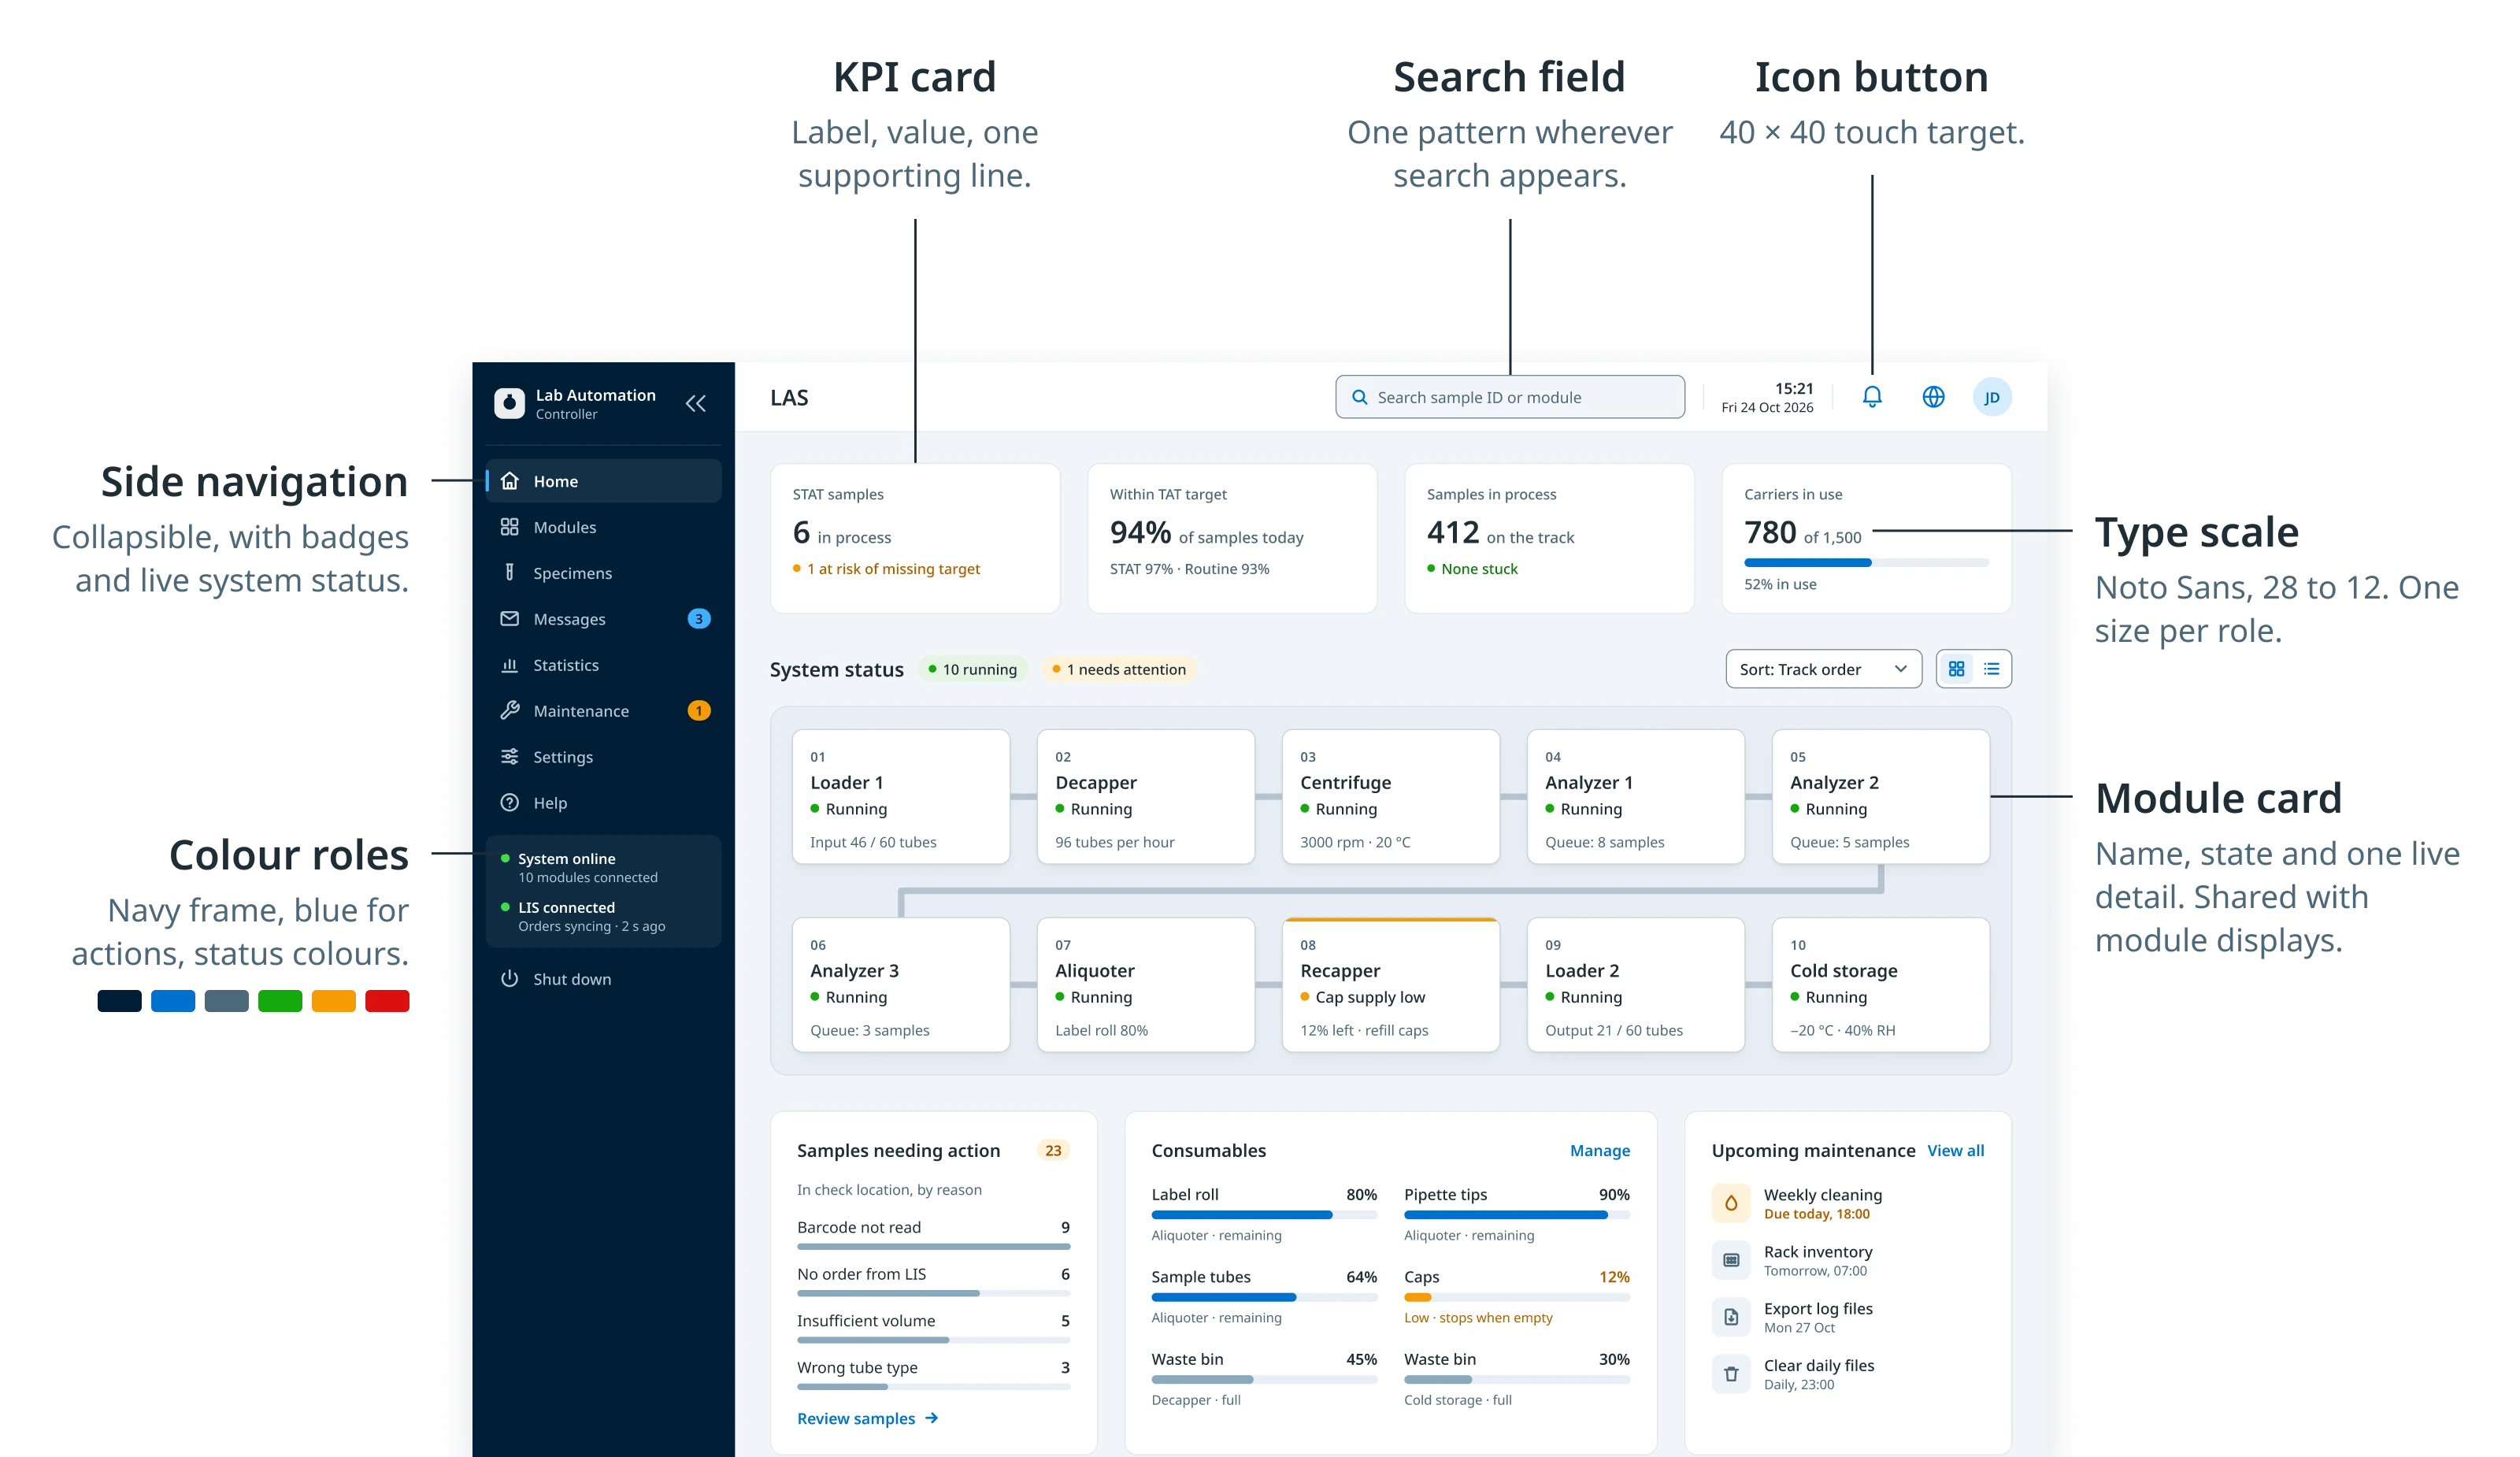
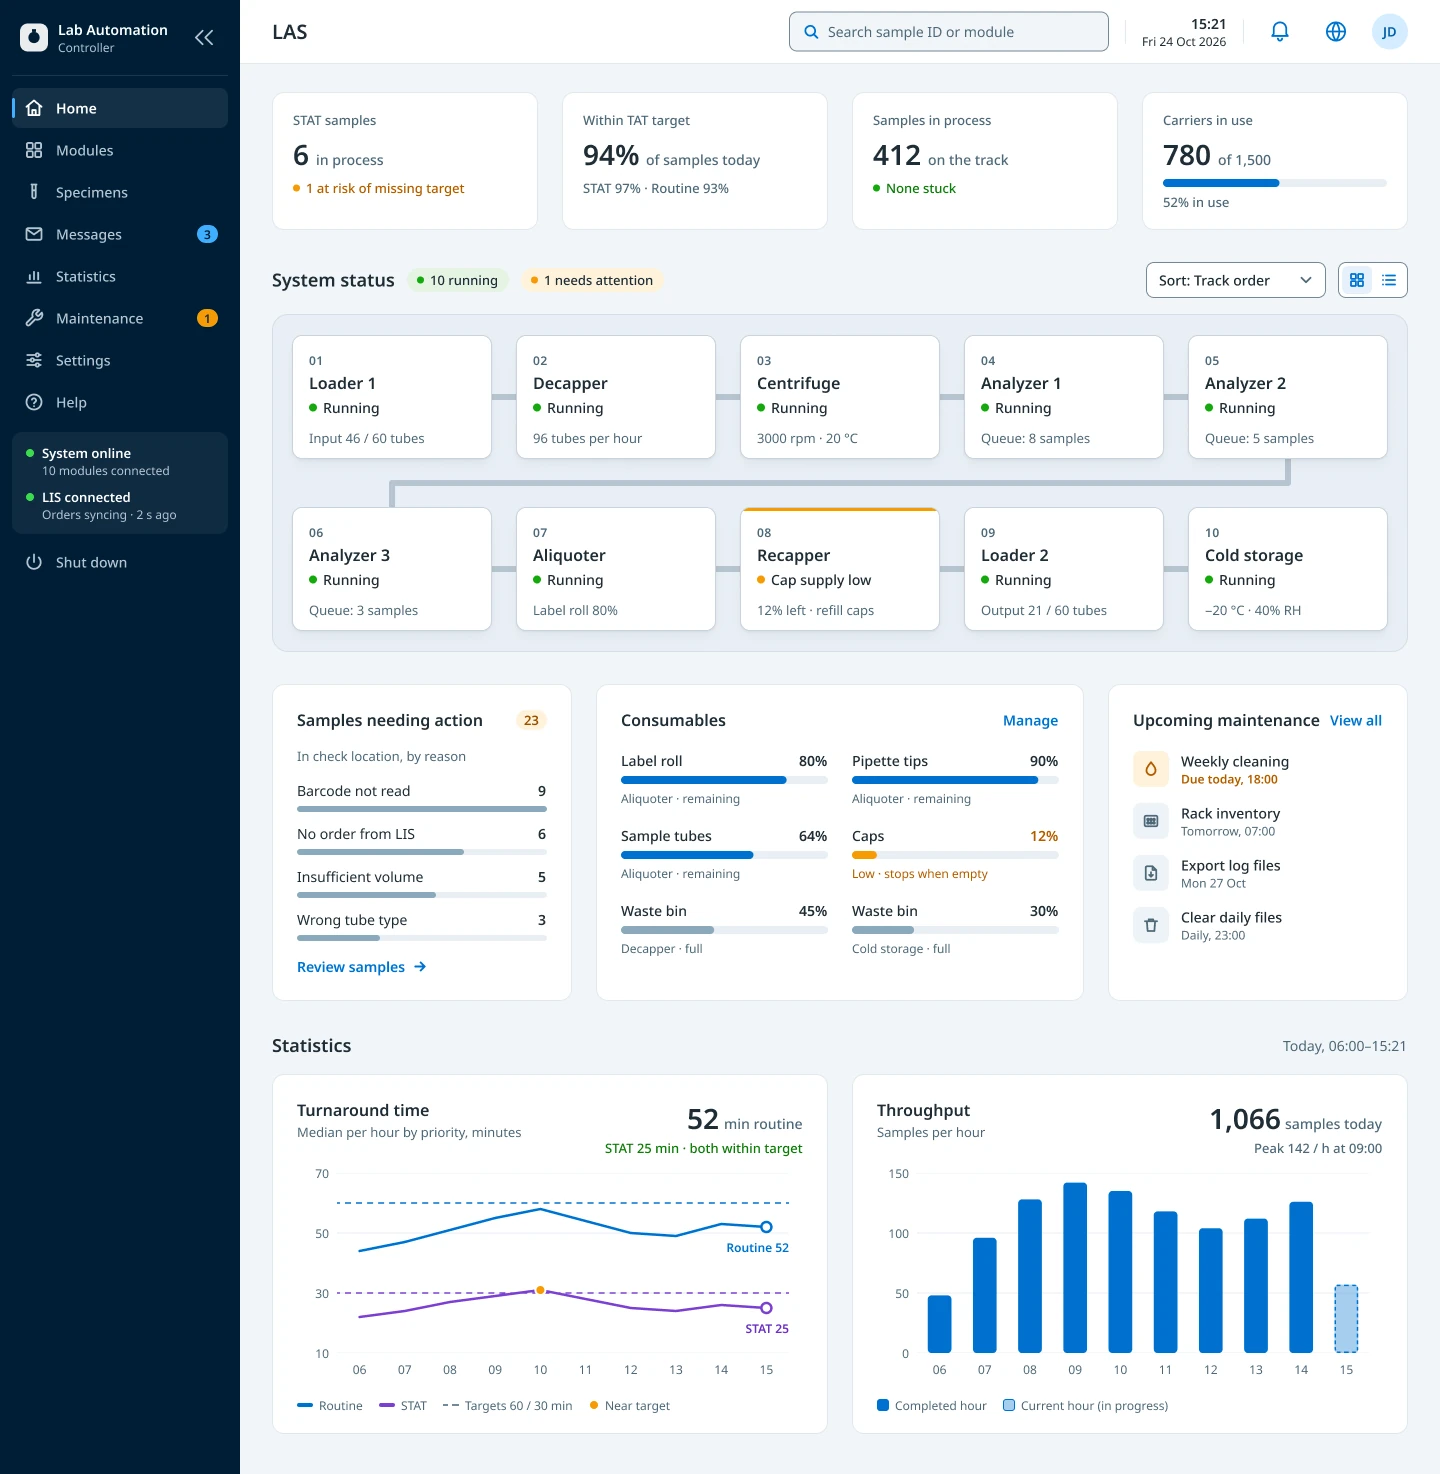
The whole system- Status of every module on the track
- Any sample’s journey, audit trail and location
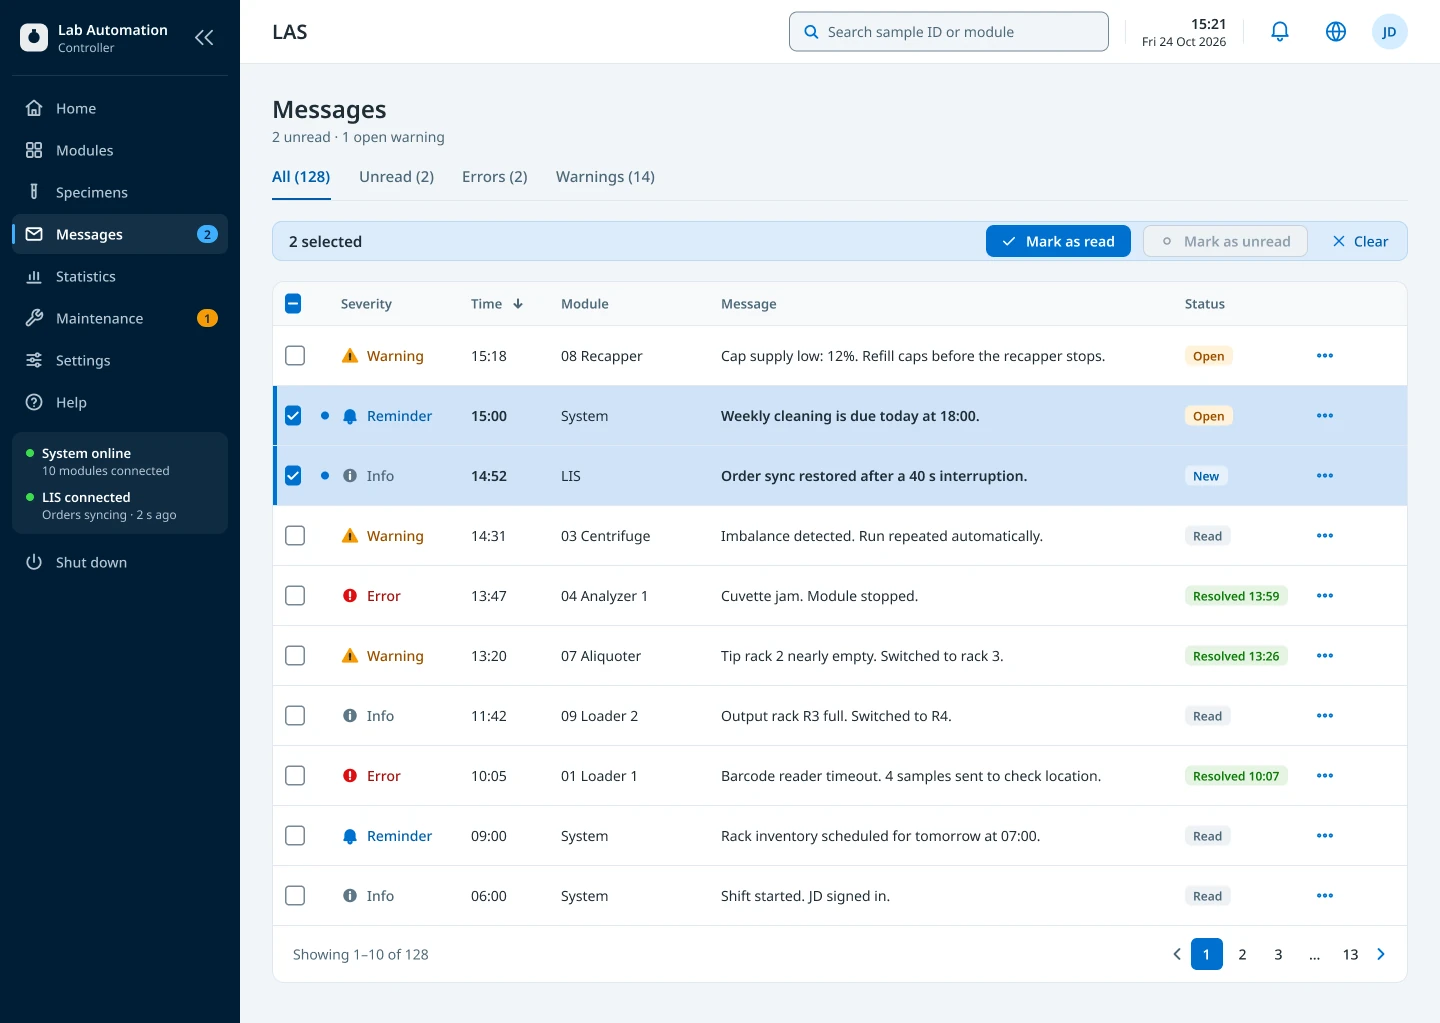
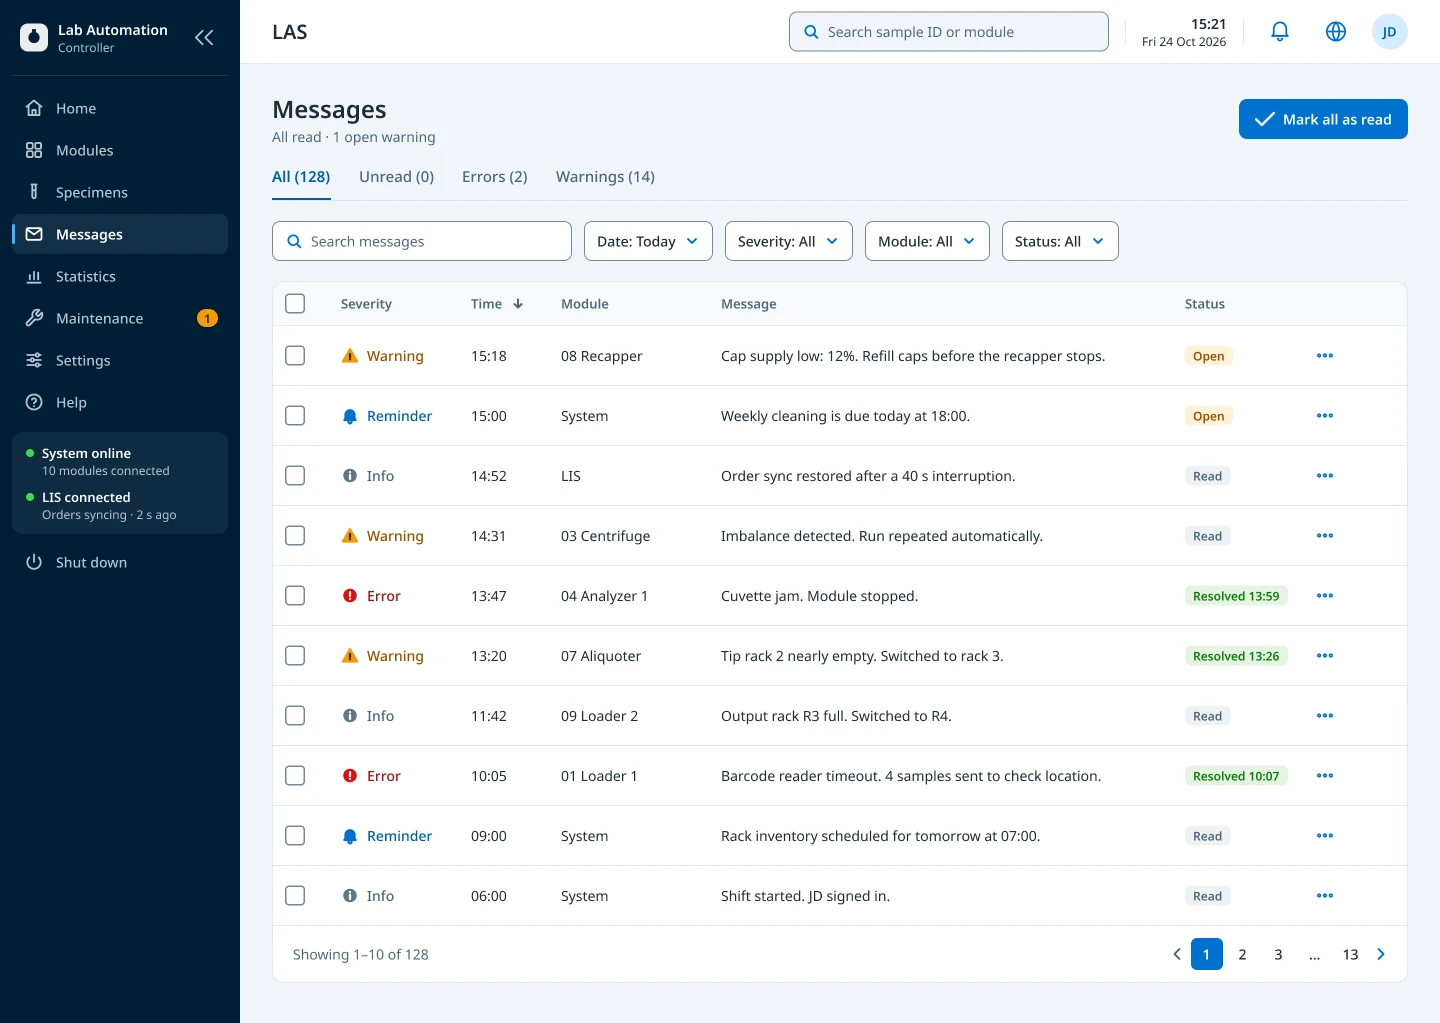
- All messages, across modules
- Statistics, maintenance planning and settings
Shared
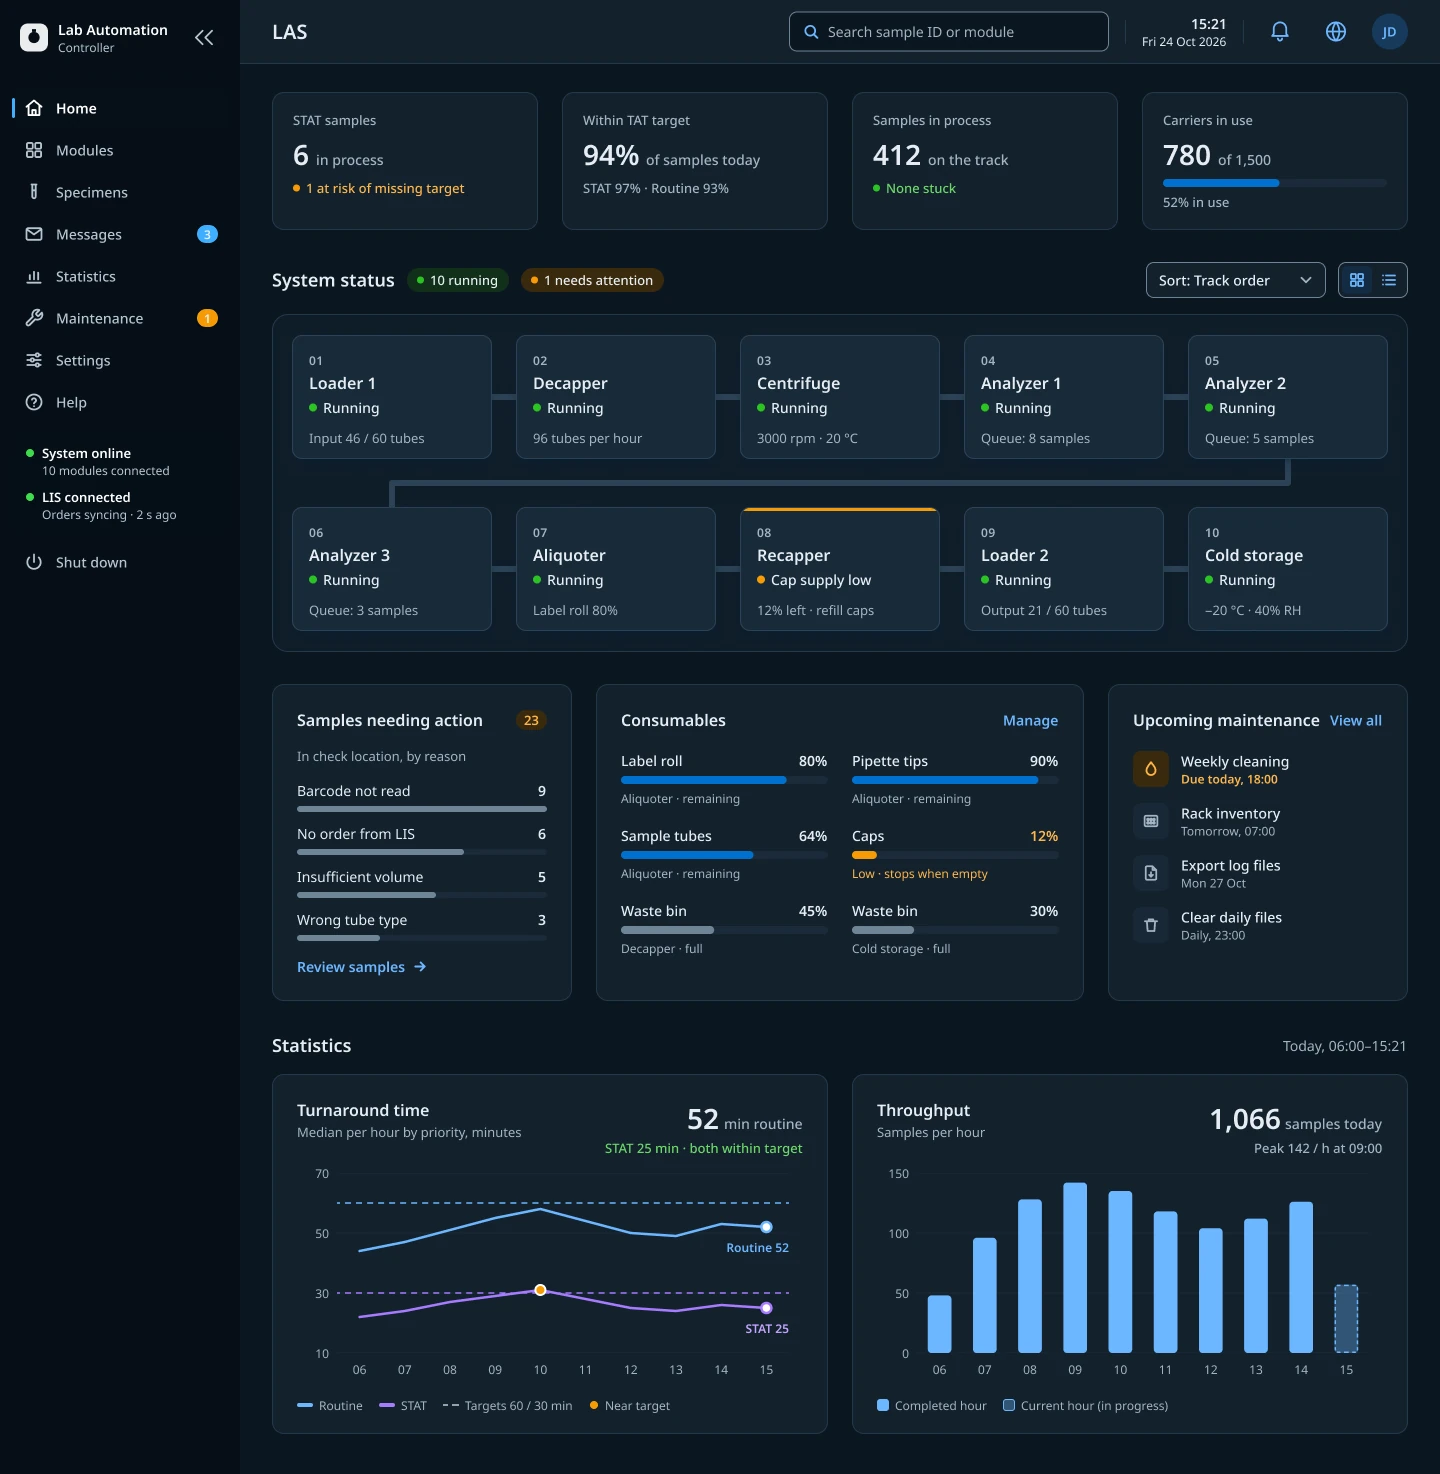
One language- Status colours, icons and labels
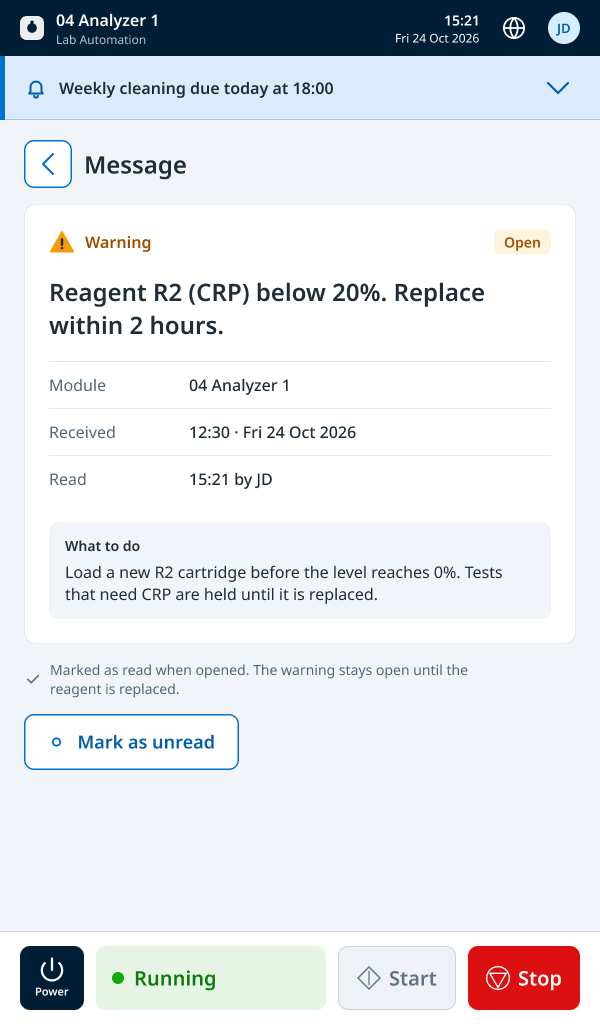
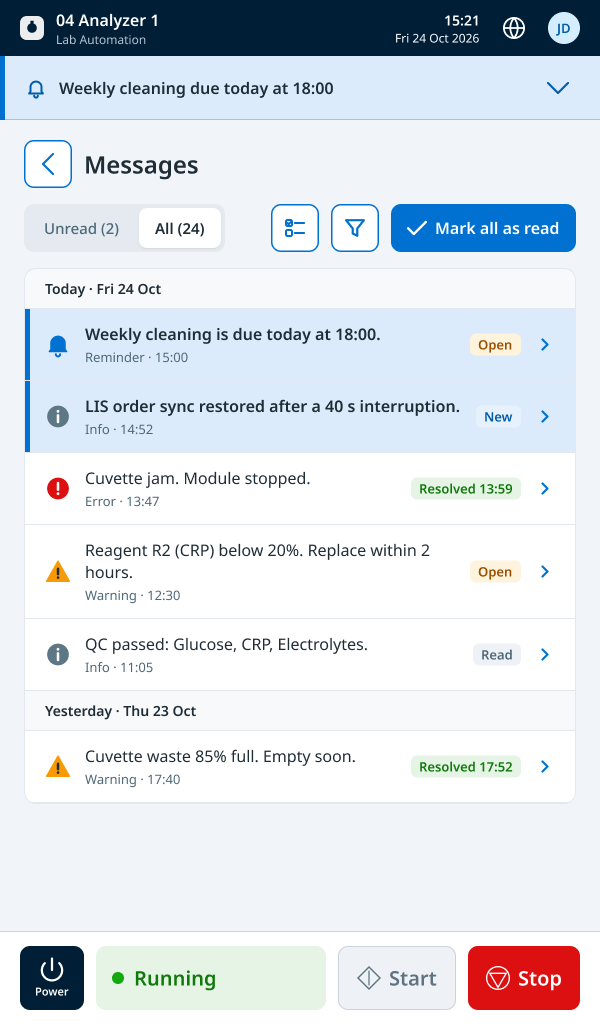
- One message model: open, read, resolved
- Same components and terminology
- Low-supply warnings at levels set per site, in percent, through the service tool
Module display
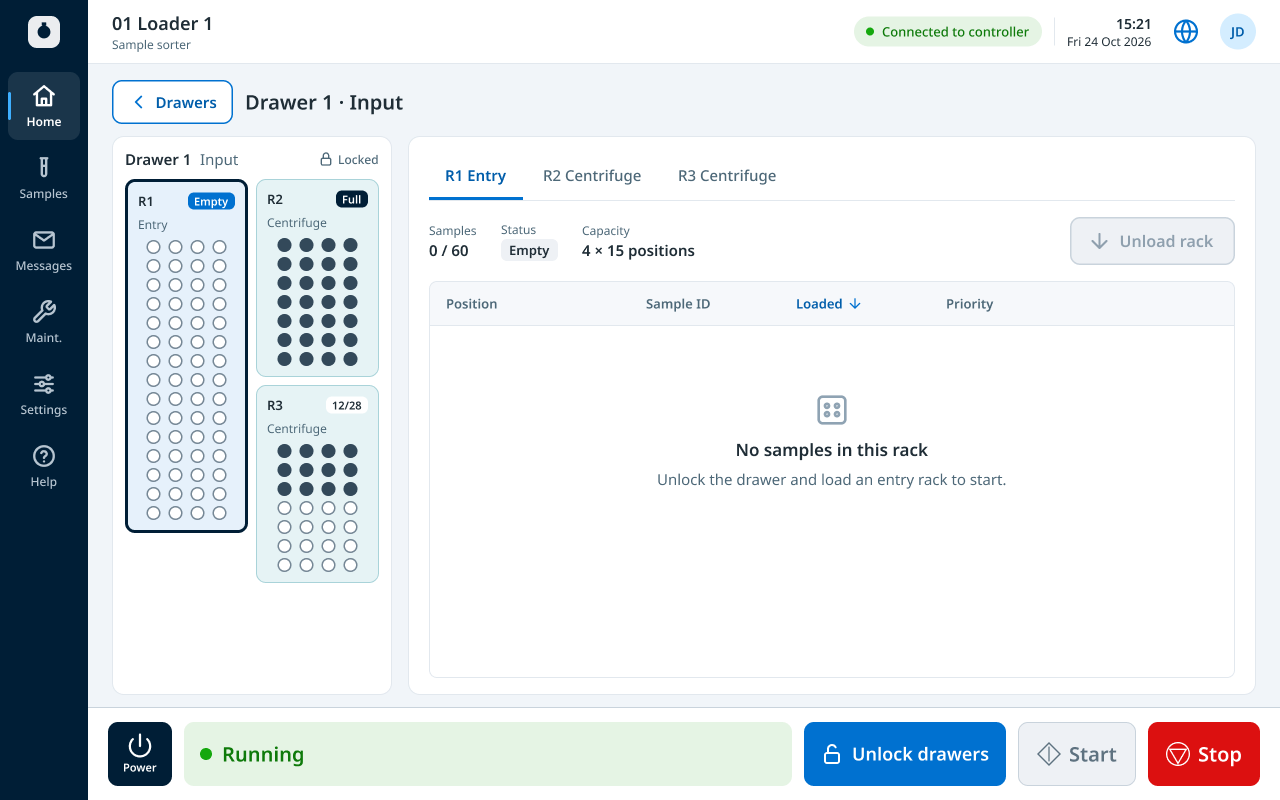
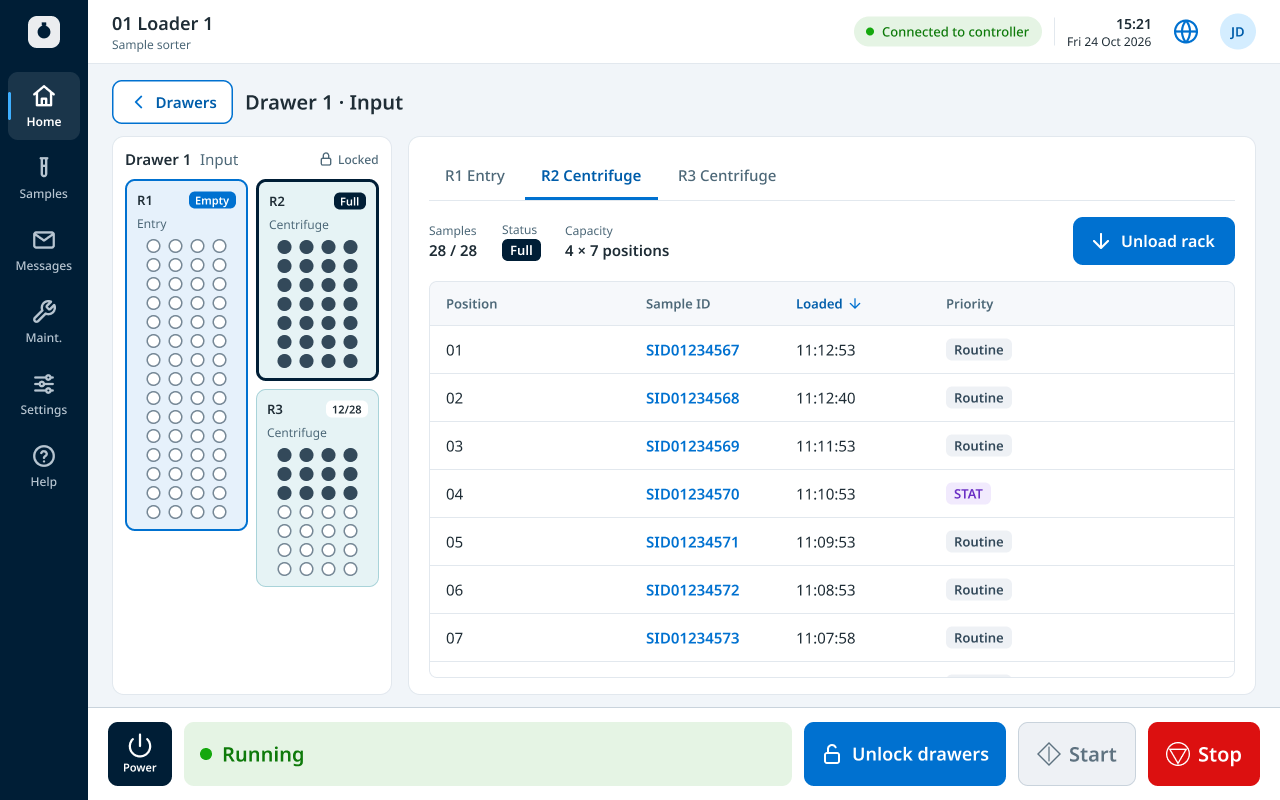
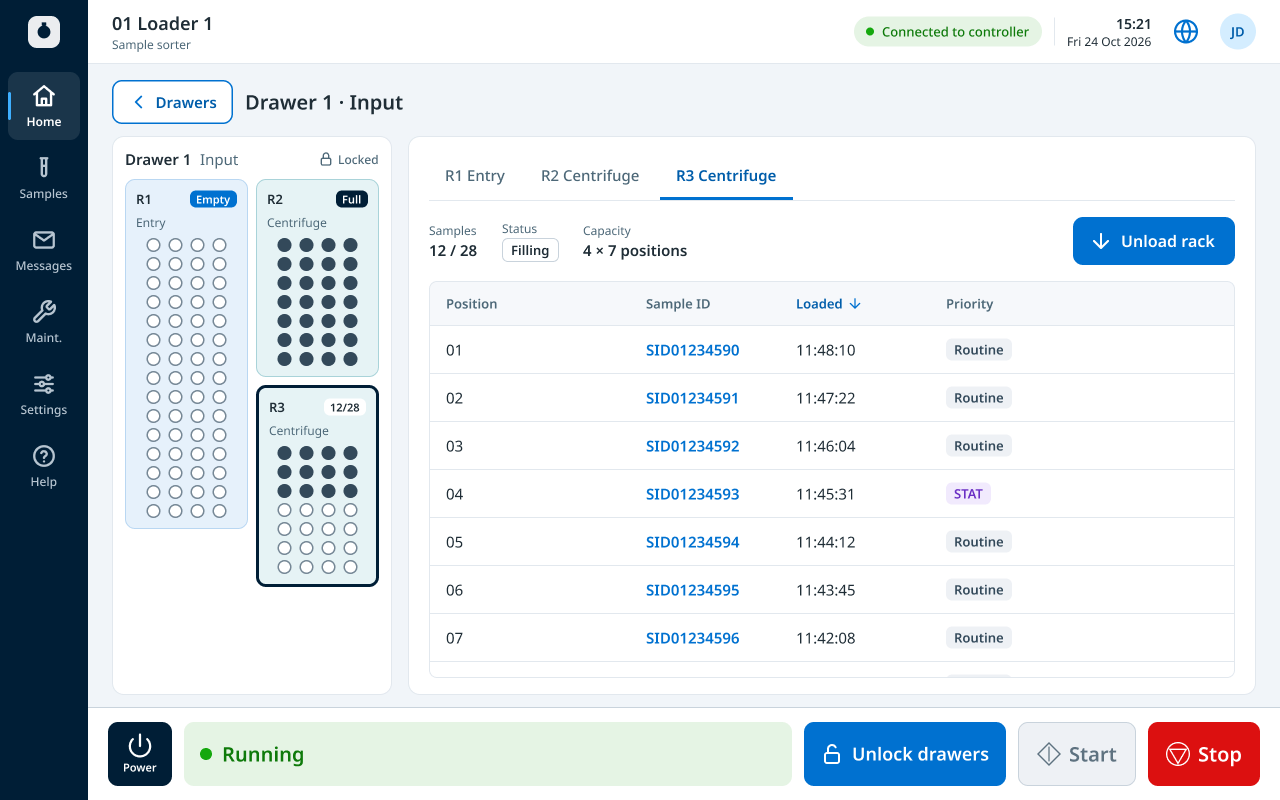
This equipment- Its own status, with Start and Stop in reach
- The details that matter for that module: samples in the sorters, caps left in the recapper, the waste bin level in the decapper
- Its own messages and maintenance tasks
Oversee and investigate at the controller. Act at the module.
My role
- Owned UX and UI end to end across eight applications
- Shaped the MVP roadmap with PM and engineering, trading scope against capacity
- Ran feature alignment meetings before each sprint to set scope and check readiness, with extra sessions for large or complex features
- Defined system behaviour, terminology and workflows with software, systems and hardware engineers
- As the main designer, owned the design system and kept every application consistent with it
- Led on-site research in three labs and an online survey with 80+ responses
- Tested daily on real equipment with engineering and V&V
Key decisions
Build the design system alongside the product
Why: The existing style guide covered only embedded interfaces. Pausing delivery to build foundations first wasn’t an option, so I built the system in step with the product.
Trade-off: We started from existing elements and an external component library, and replaced them with our own as capacity allowed. Speed came first; full consistency followed.
Scope the MVP around a desktop core
Why: Marketing, PM and other teams brought ideas with real customer value, such as a mobile app so staff in 24/7 labs could follow runs from the break room. I agreed with the value. But the team started small, with limited software and hardware capacity, and only grew later with internal and outsourced engineers. Taking everything on would have put the MVP at risk. With PM and engineering, I prioritised the roadmap, weighed each feature against capacity, and moved the rest to post-MVP. Before each sprint, feature alignment meetings set the scope and checked readiness; larger features got their own sessions. Touch monitors for the desktop apps were also on the table. After years with the old software, users wanted something fresh, and touch had real appeal. But it would have needed an on-screen keyboard in nine languages, and touch only adds value if it works reliably. We kept the MVP to keyboard, mouse and barcode scanner, and moved touch to the roadmap.
Trade-off: Users waited for features they wanted, mobile included. The home dashboard was cut the same way: shift summaries, a live message feed and cold-storage tracking all waited. In return, the core workflow stabilised first, and everything after it had something solid to build on.
Prioritise what operators see, in every state
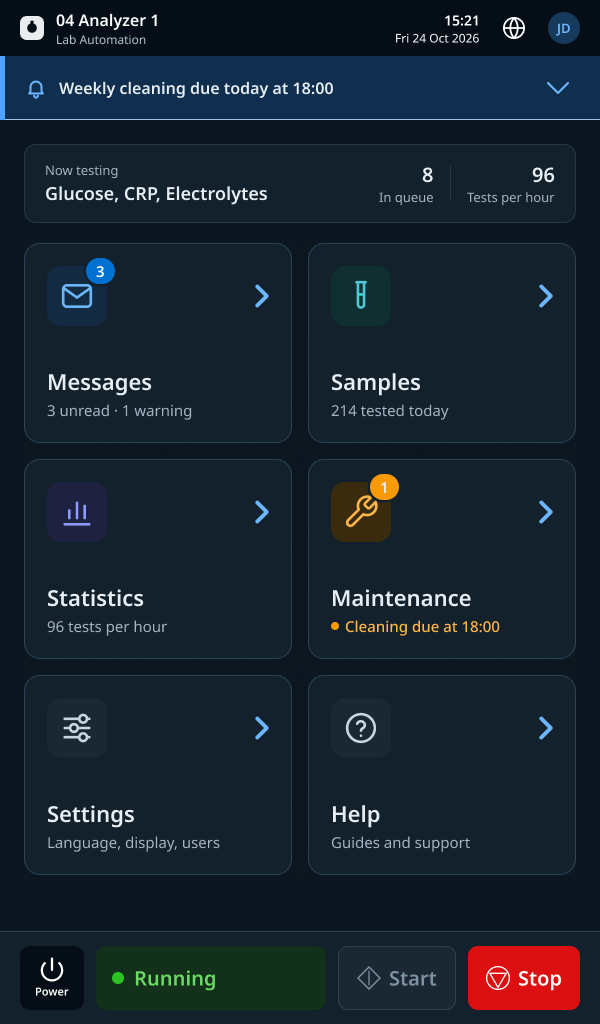
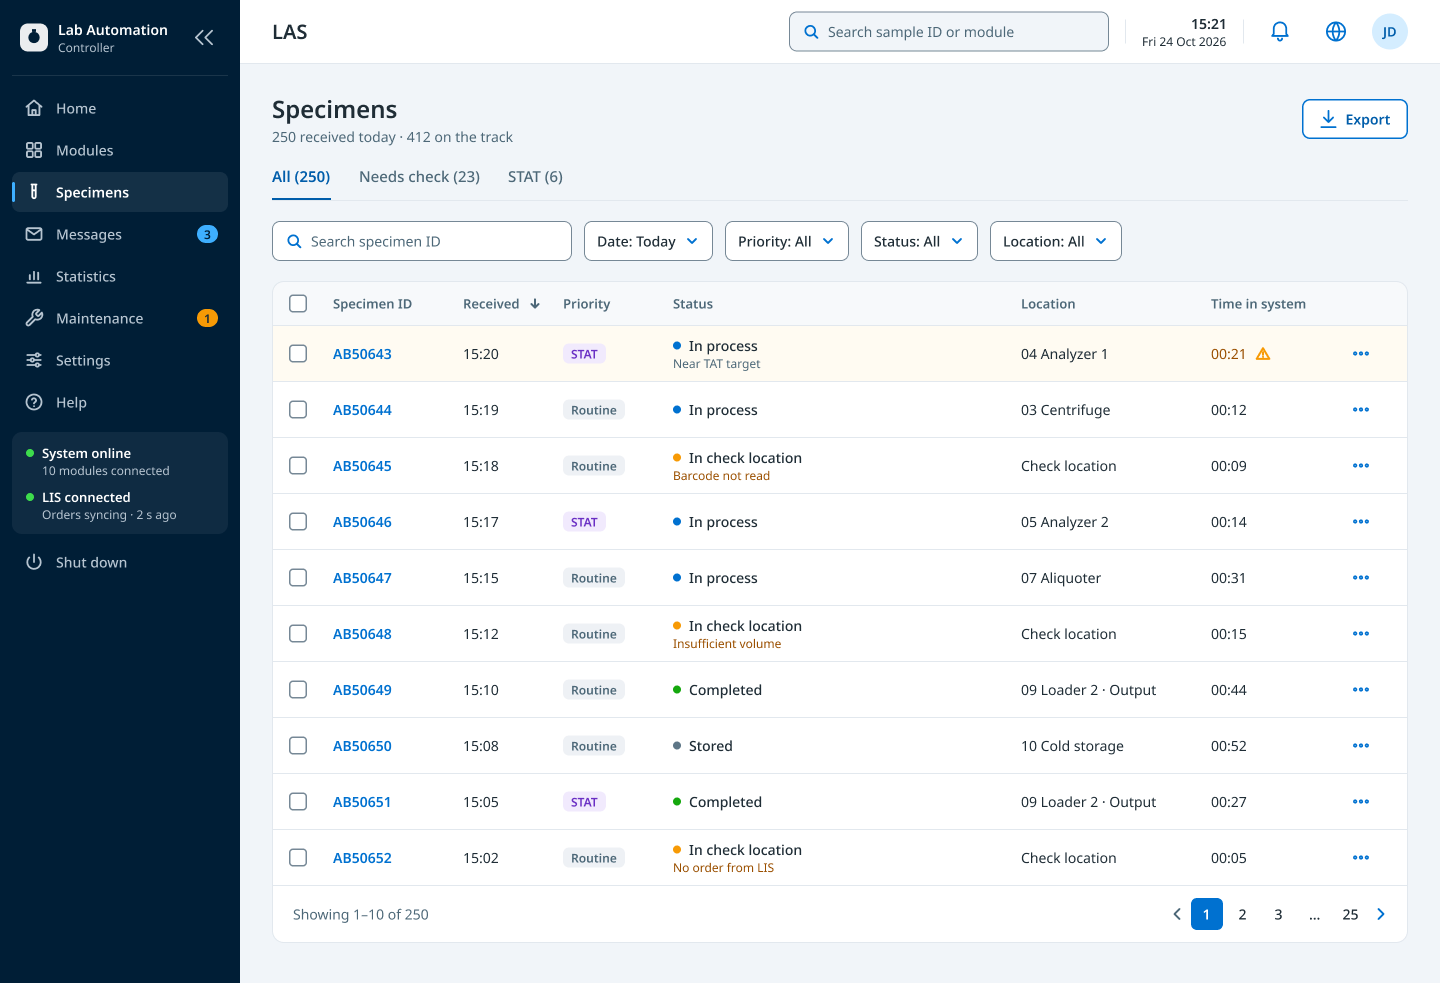
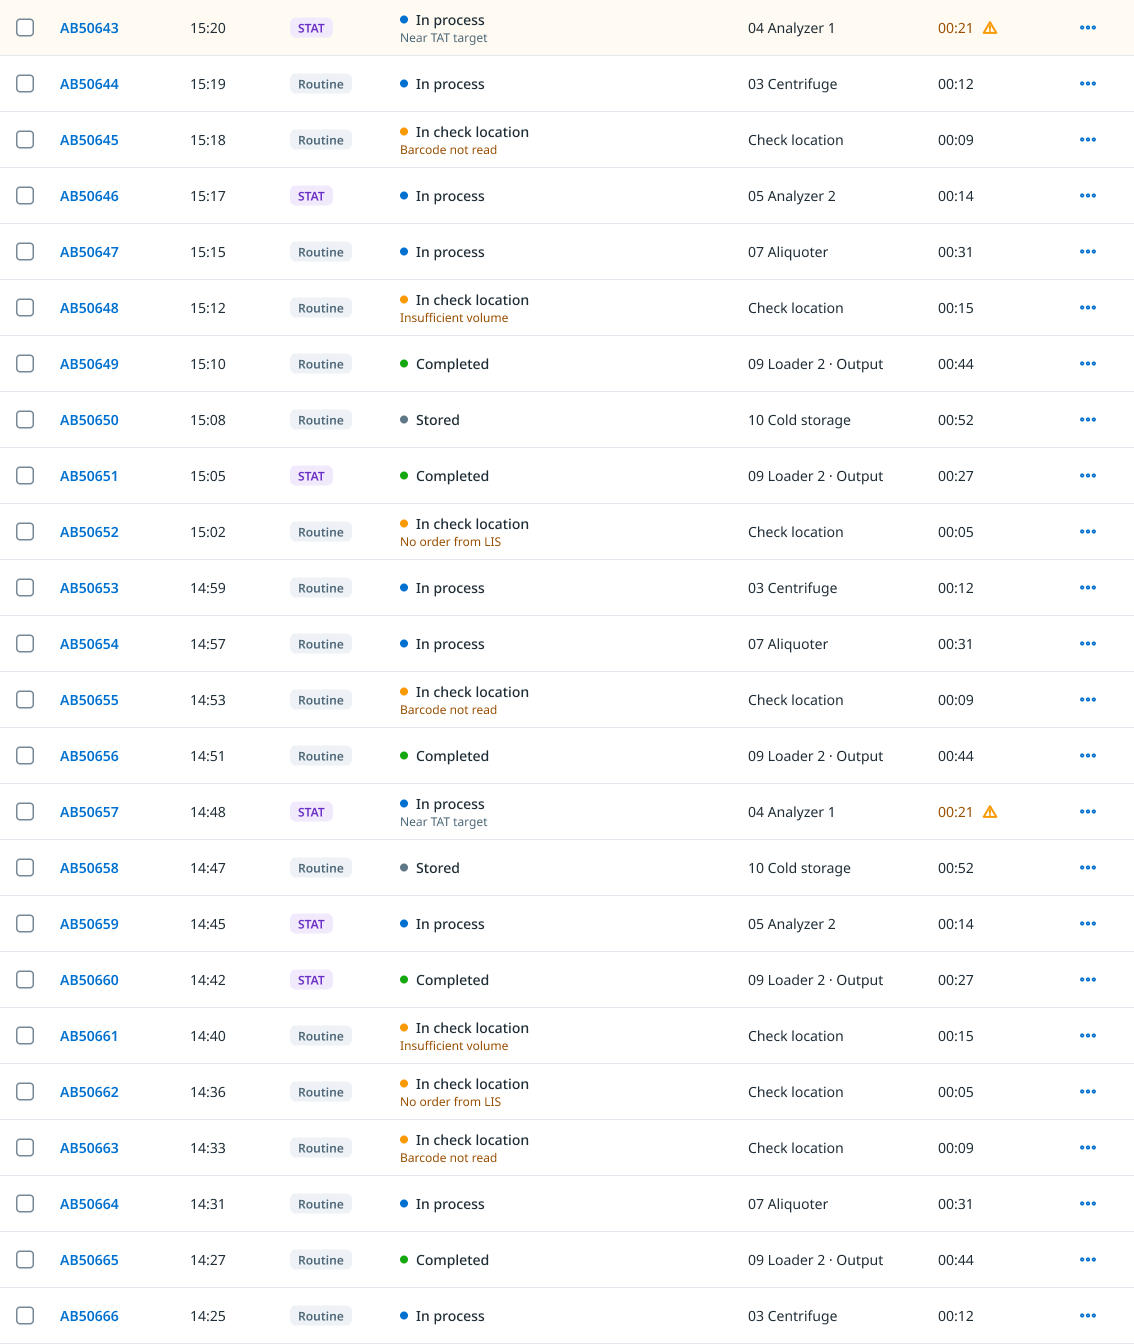
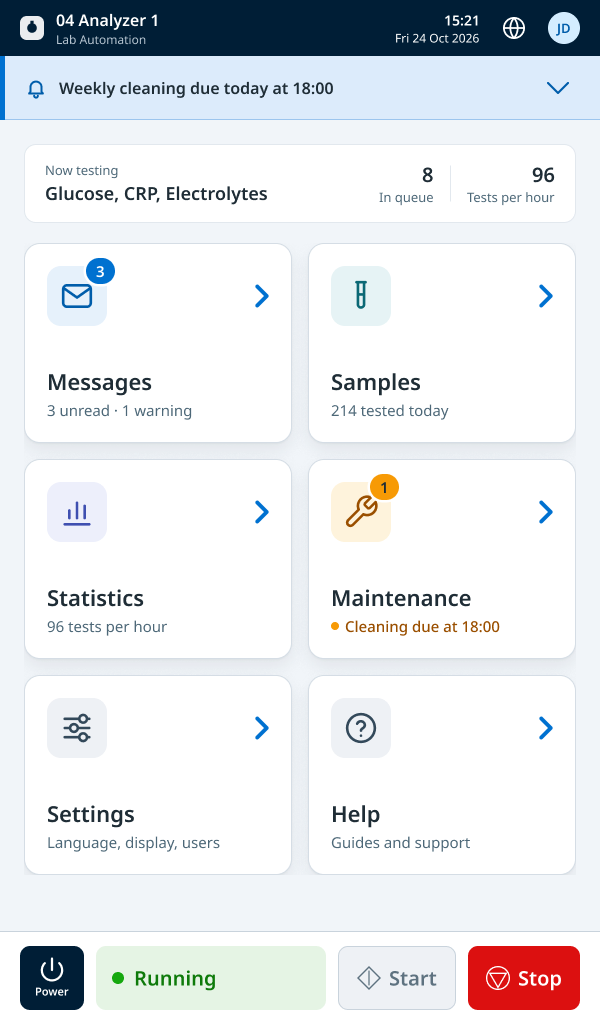
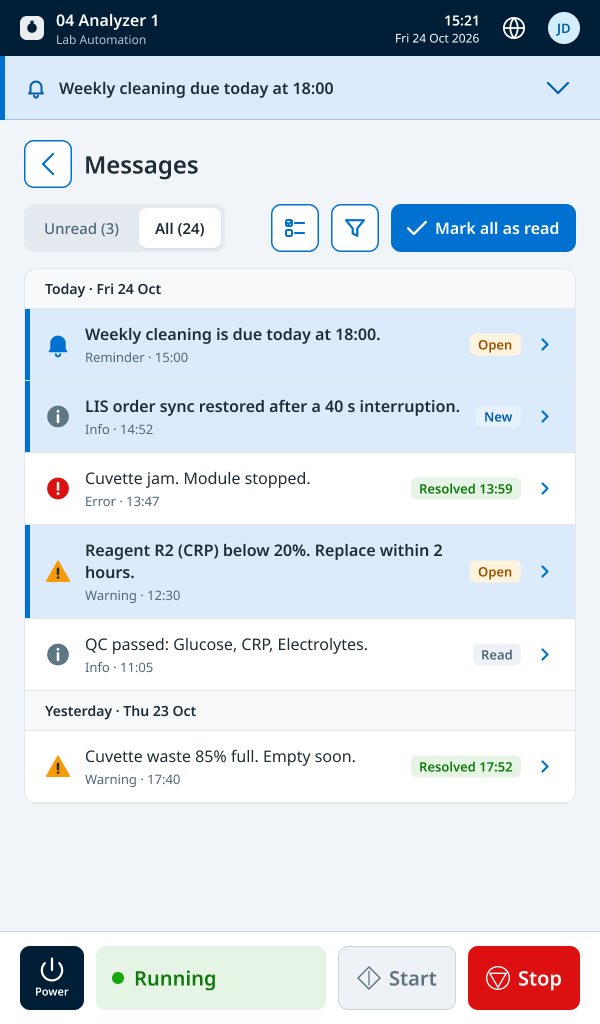
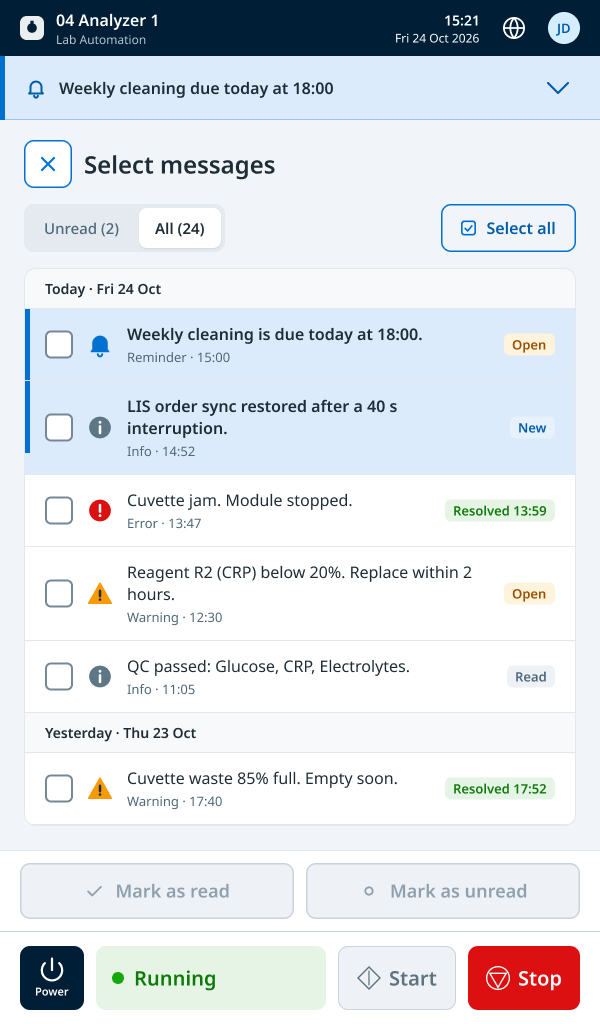
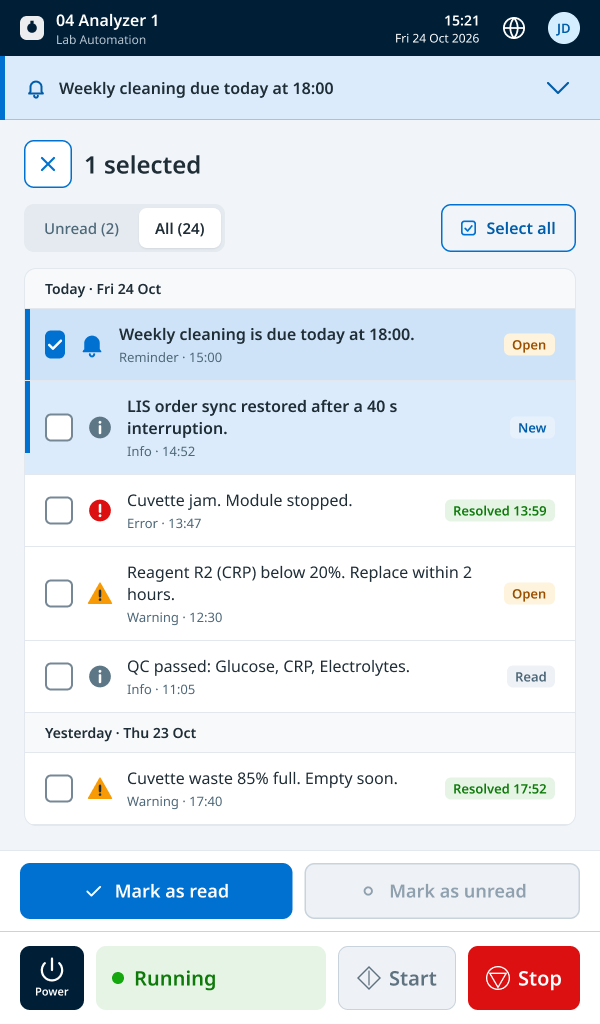
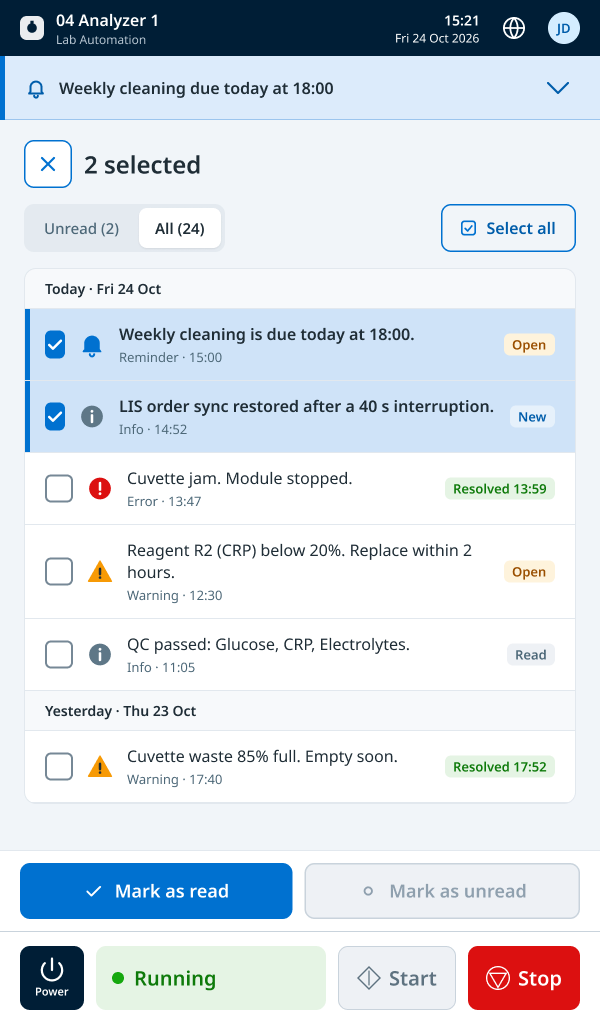
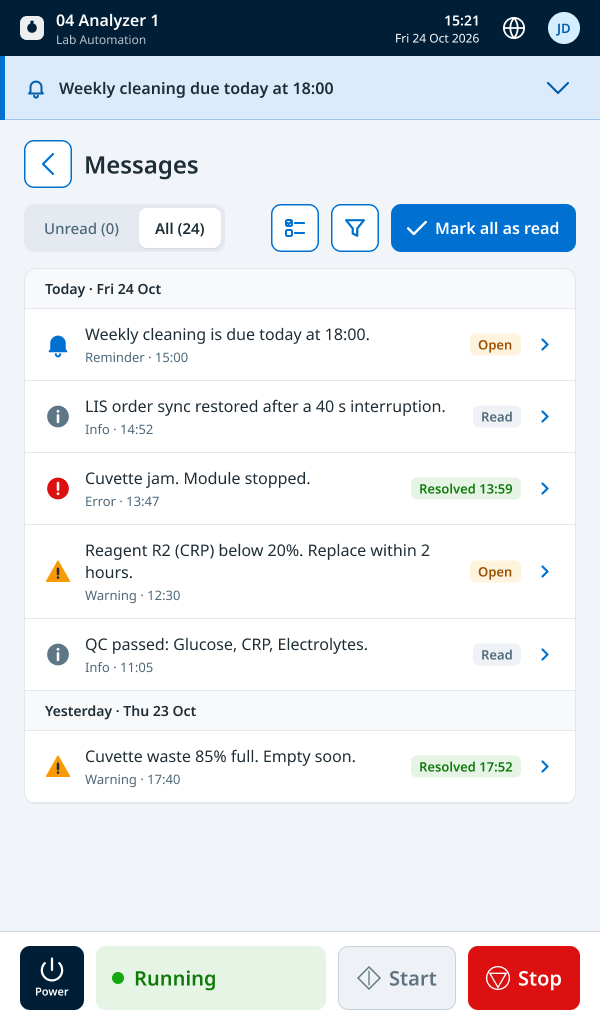
Why: Operators watch a busy system for entire shifts, and on mechanical equipment, missing the wrong signal has real consequences. With engineering, I defined what is always visible, what sits one step away, and what appears only when it matters, starting from the normal state where everything runs. Each module card shows its status and one key figure; the detail is one click away. Faults show how the hierarchy escalates: anything that stops a module and needs a person is prominent on both the controller and the module display, while lower-priority conditions get a warning label.
Trade-off: Some information operators asked for moved one step away, and lower-priority conditions became less visible in the MVP. The payoff is a calm normal state, where anything that stands out deserves attention. The rules hold in the details: acknowledging a fault doesn’t clear it until it’s fixed, and reading a message never resolves it.
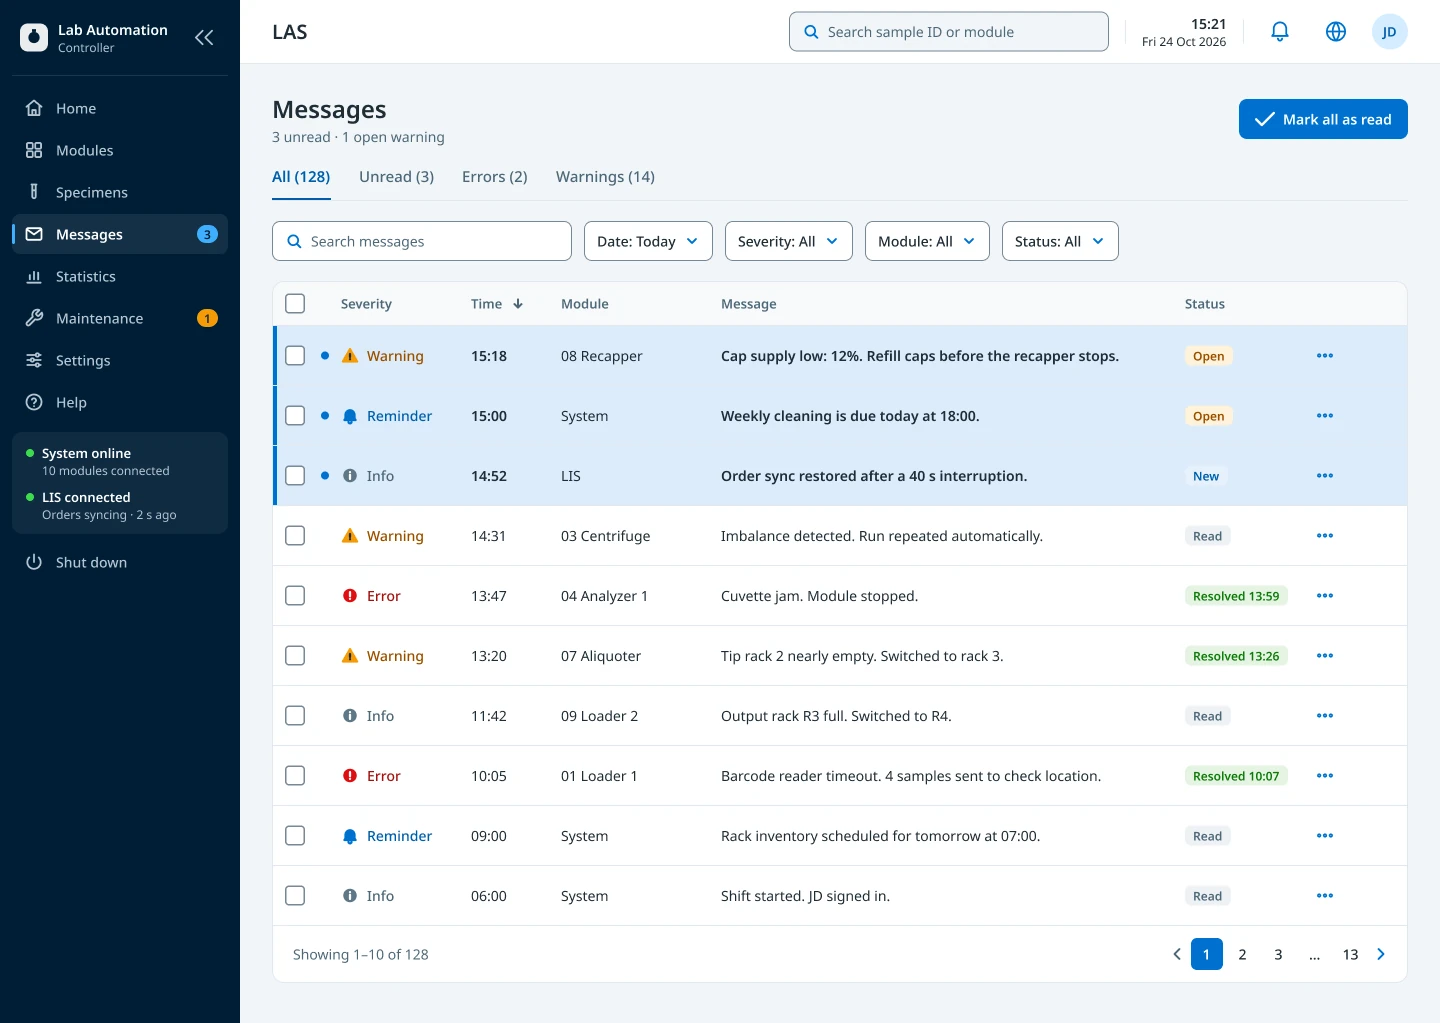
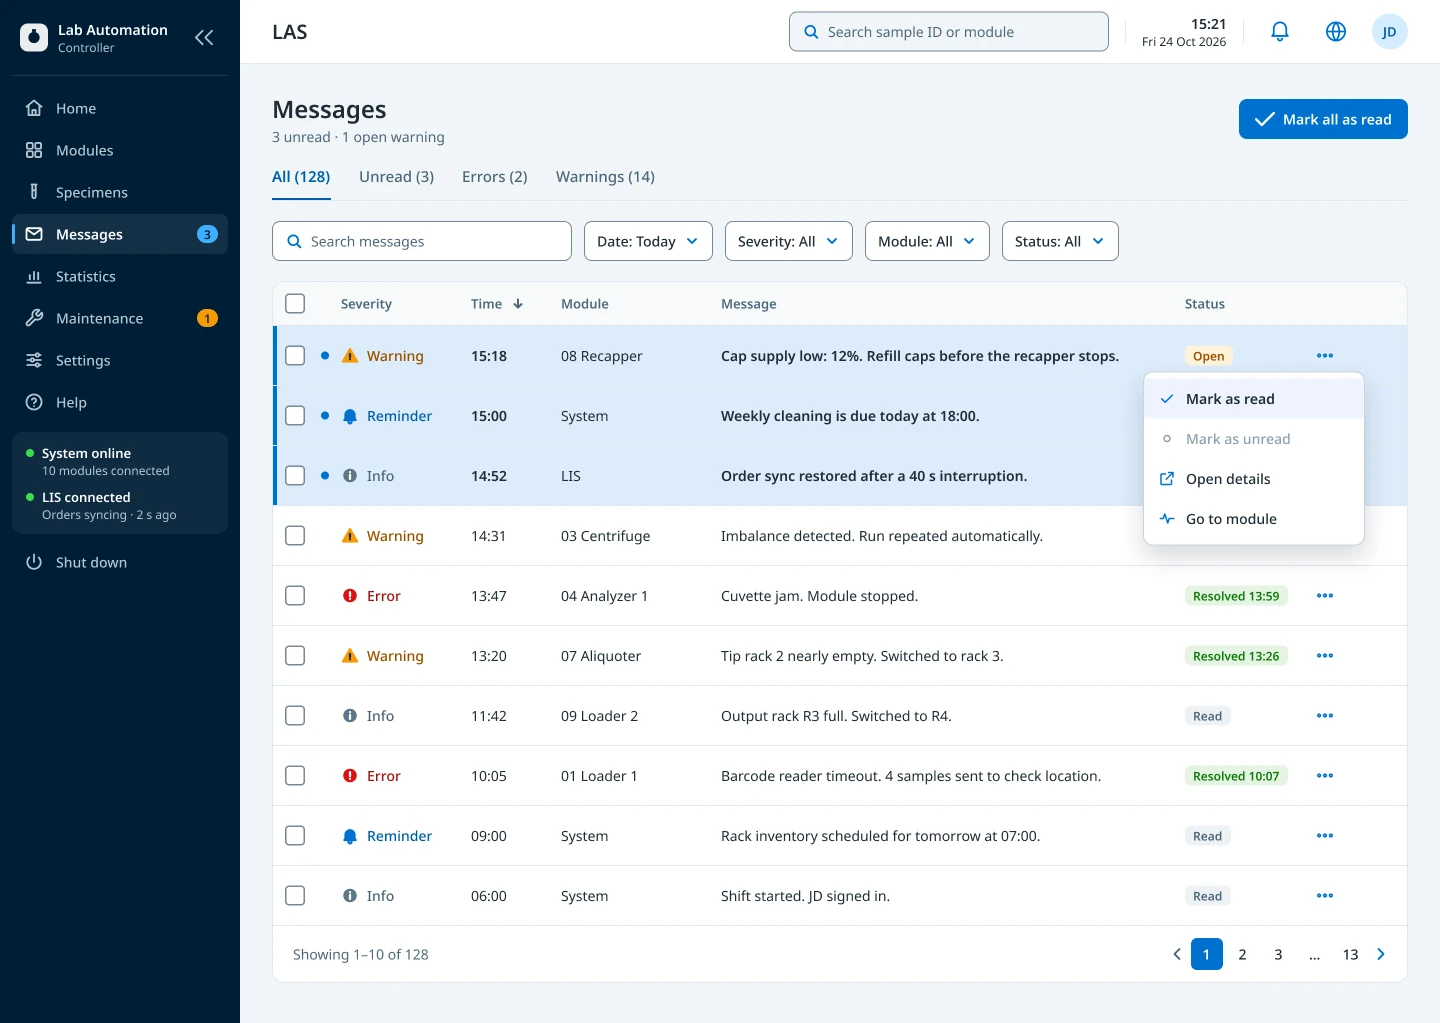
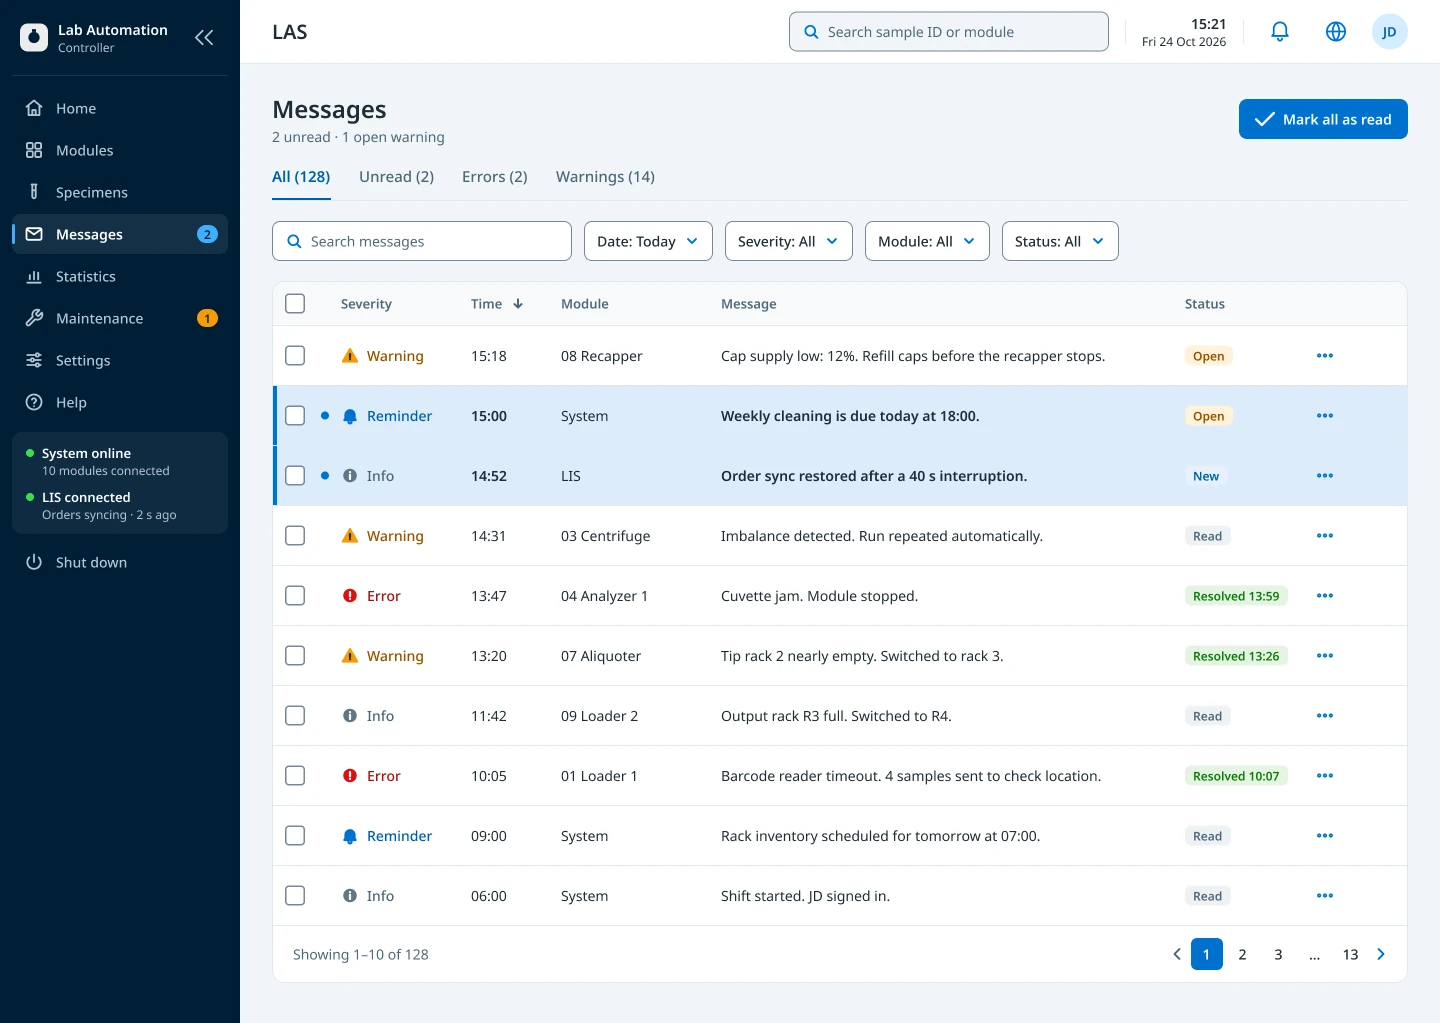
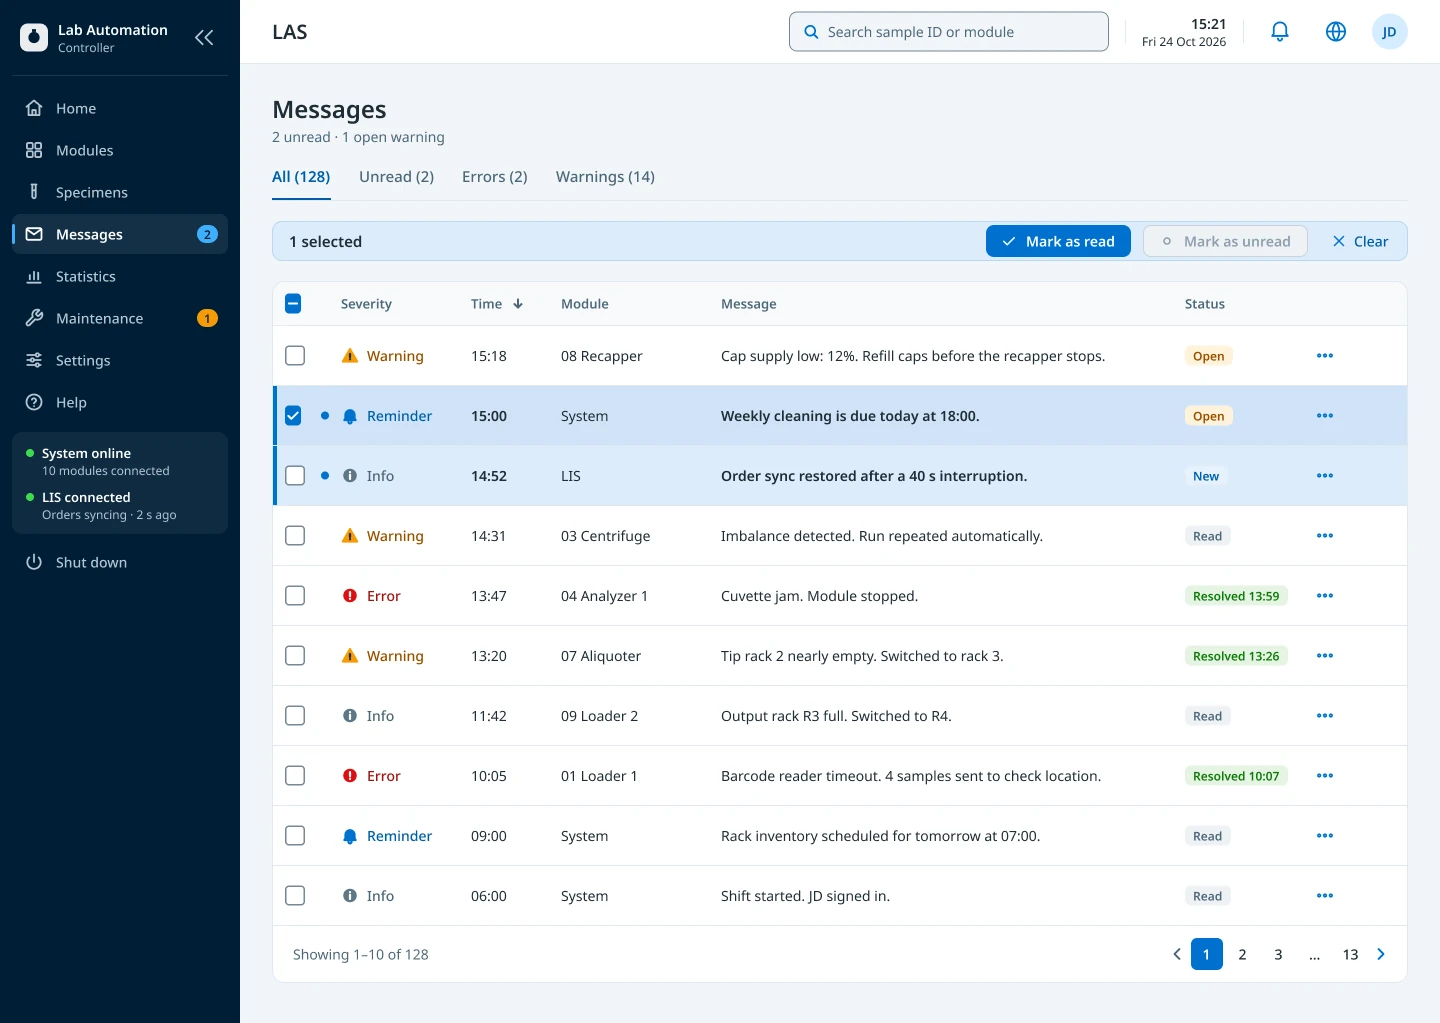
Example: how a critical fault escalates
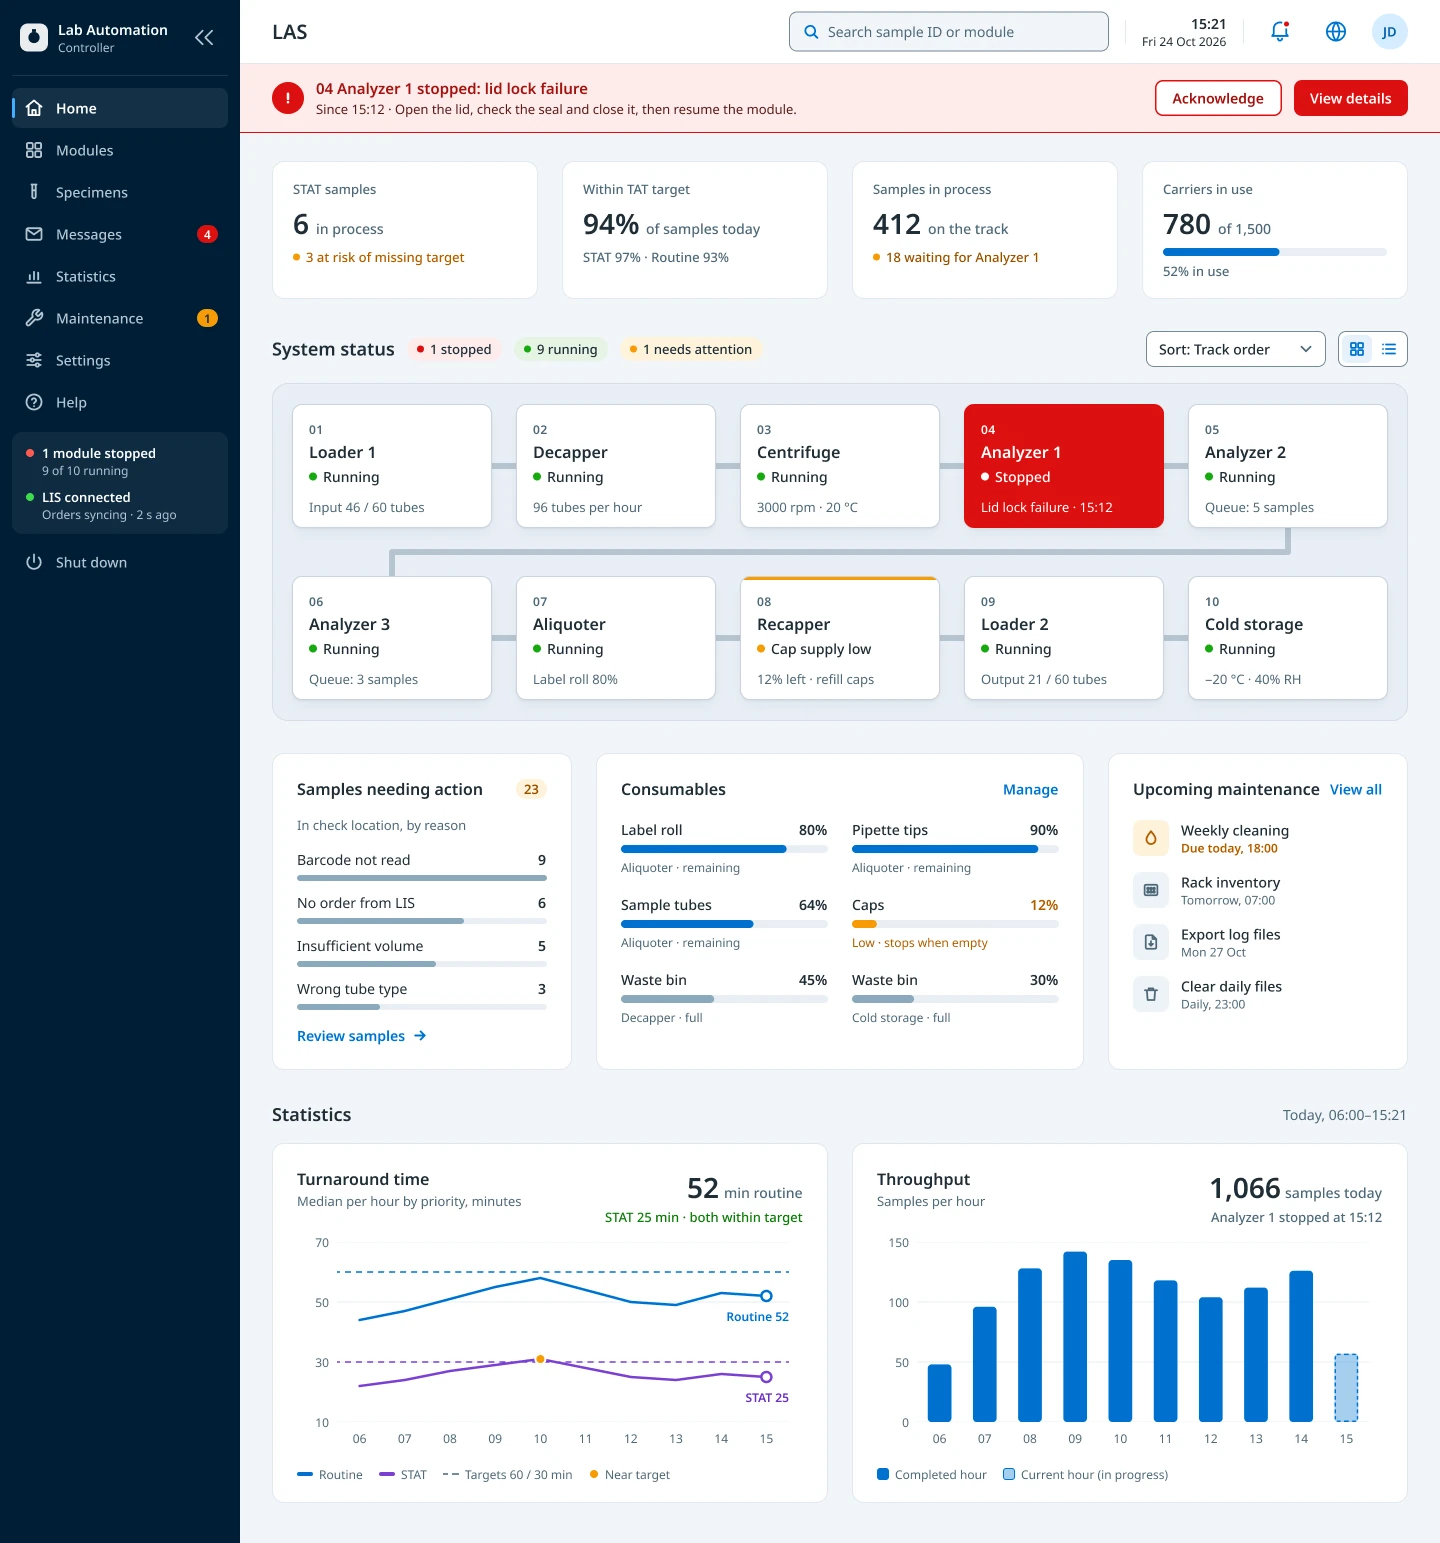
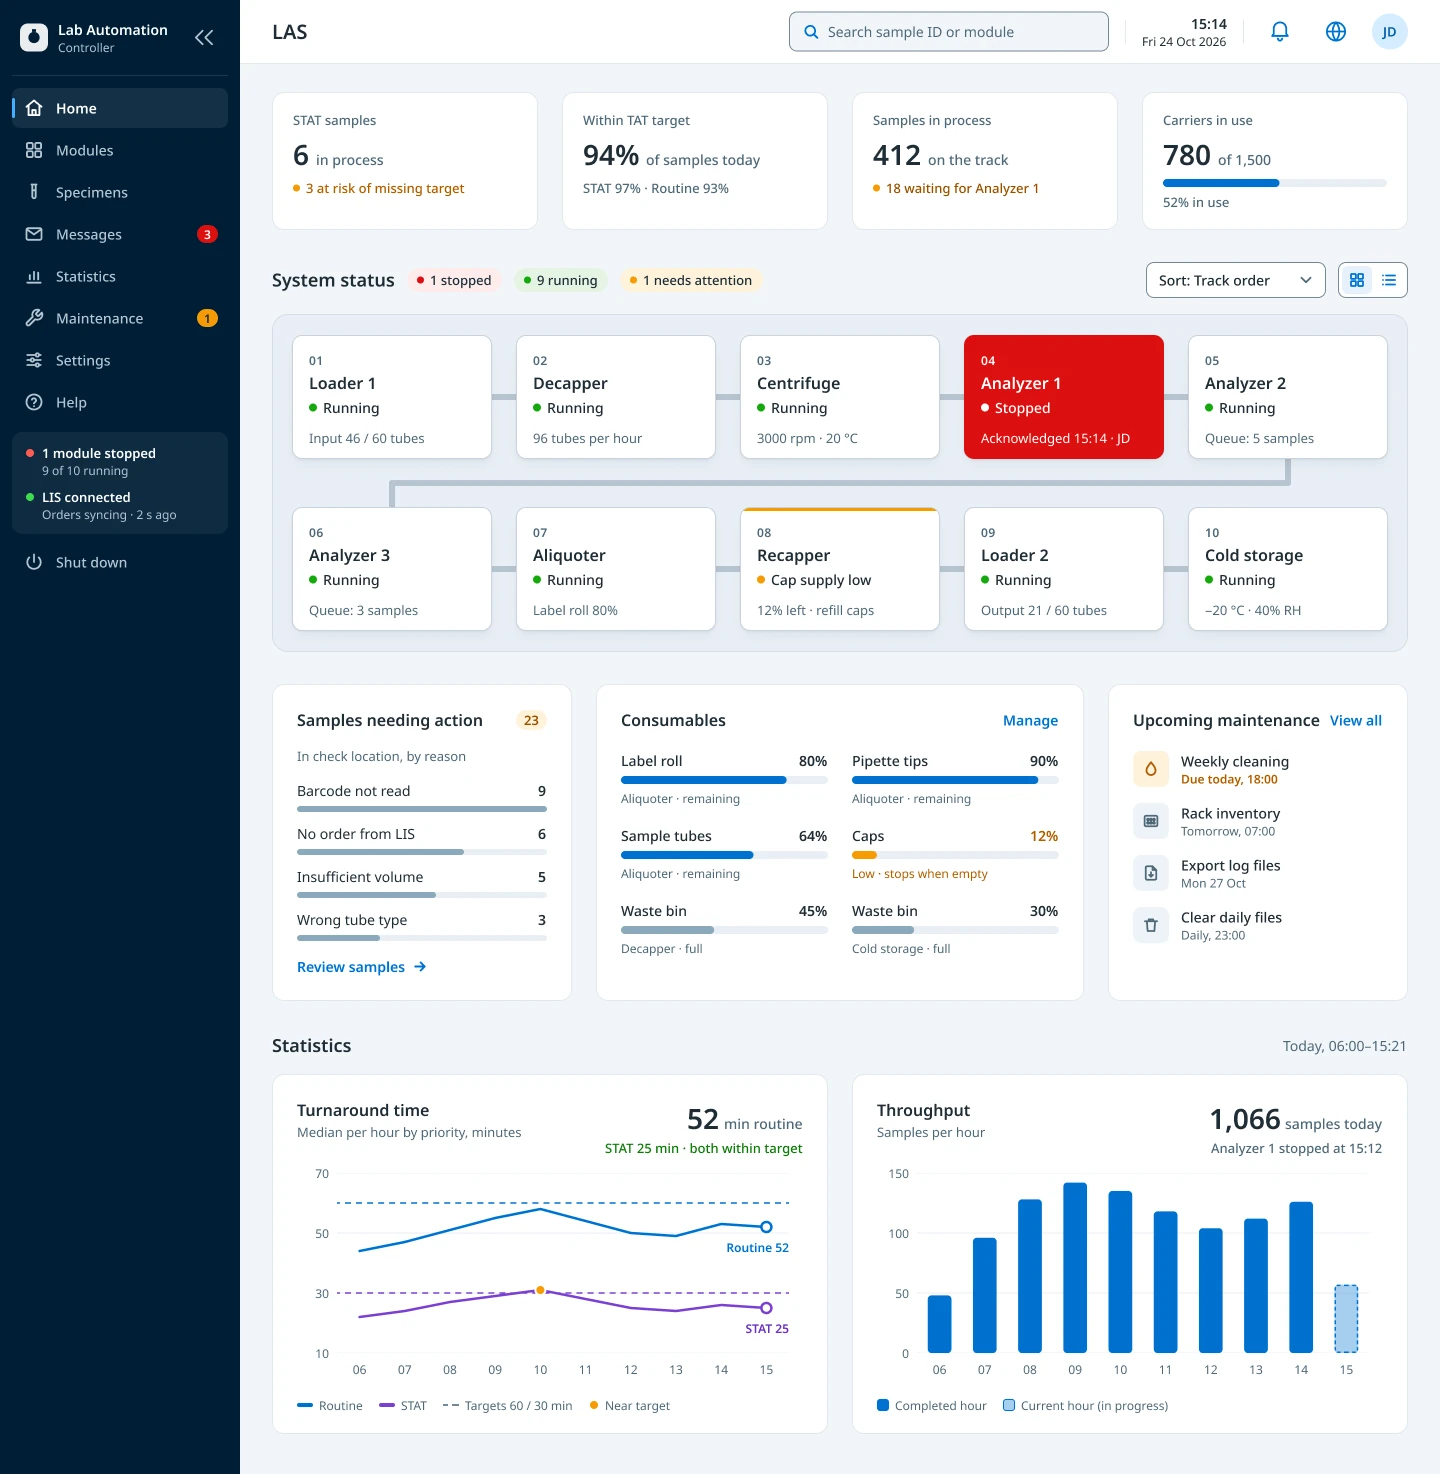
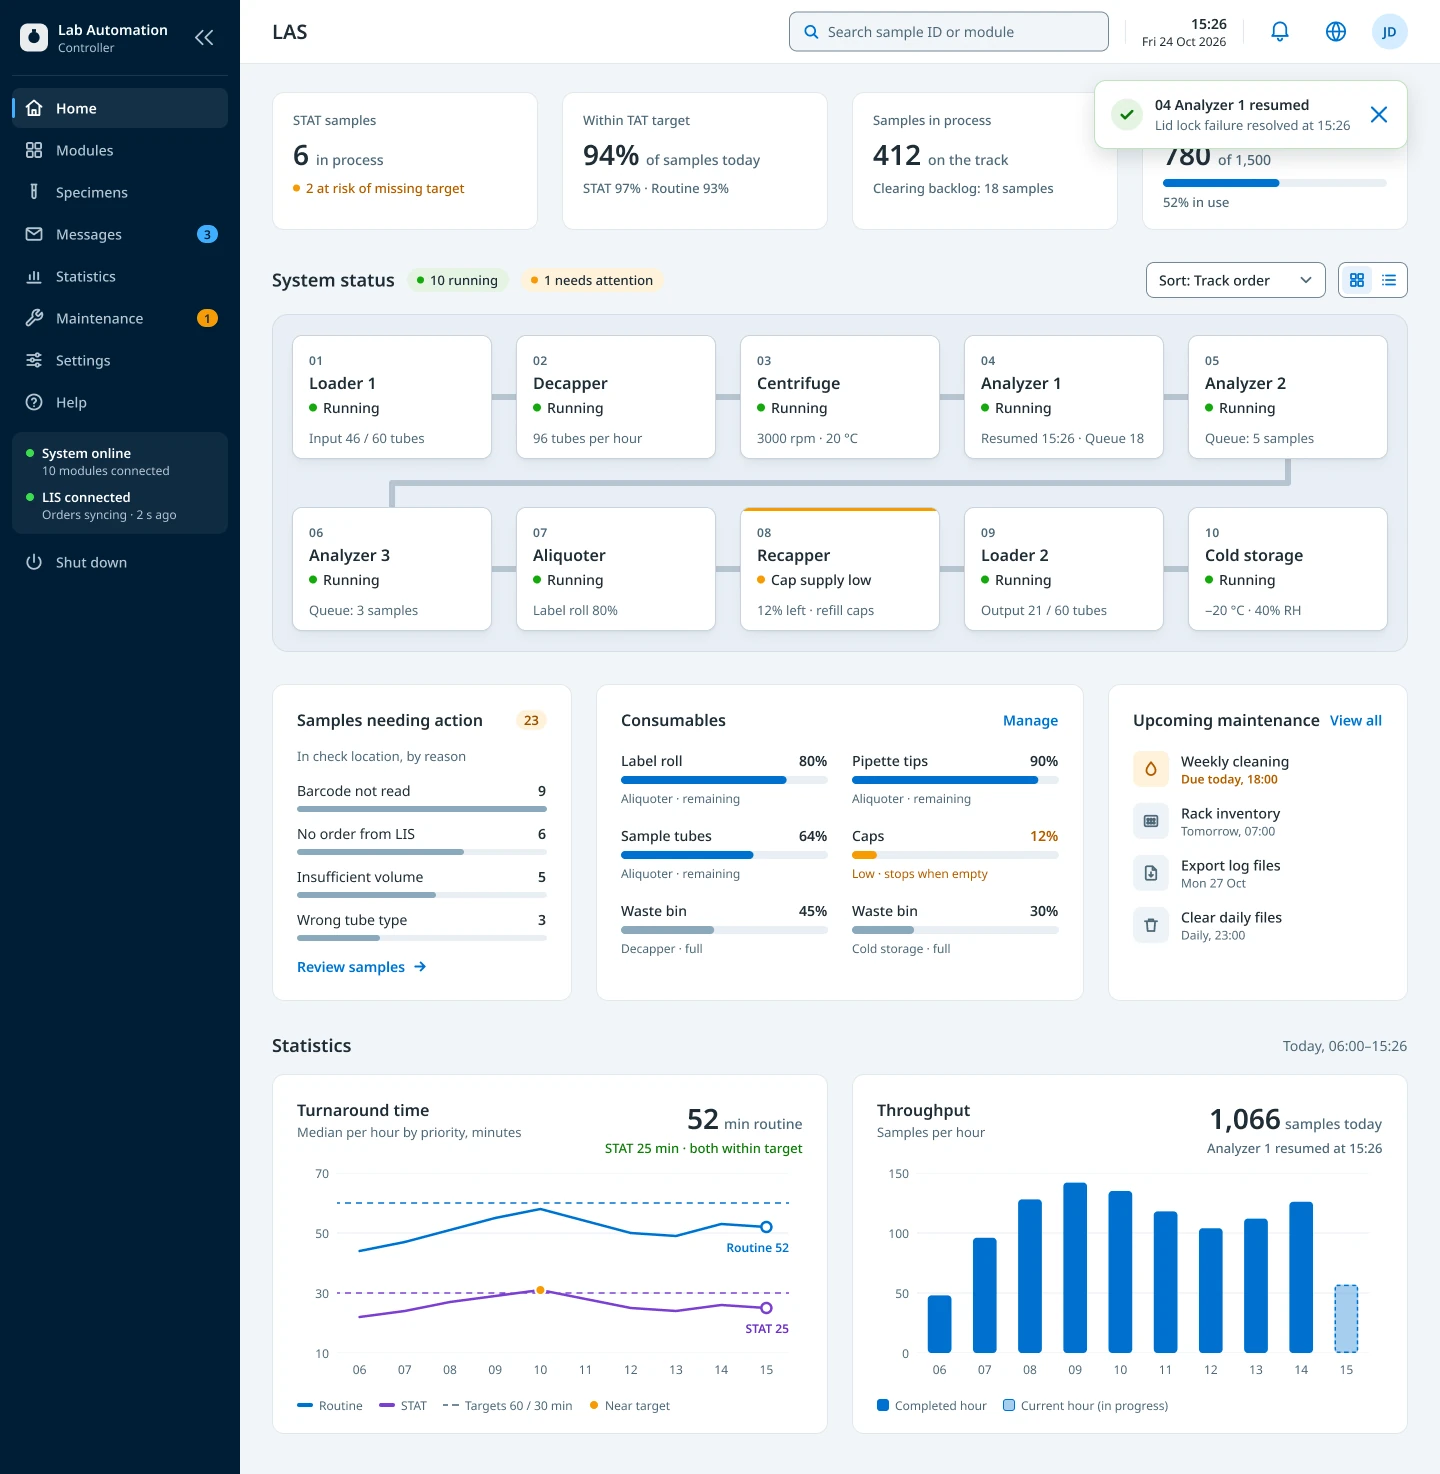
A stopped module takes over the screen. Acknowledging clears the banner; the card stays red until the module runs again.
Design for nine languages from the start
Why: The system was built for a global market, and the MVP had to support nine languages. Text length varies widely: German and Finnish run long, Chinese runs short, and a label that fits in English can overflow a button or a narrow module display. Instead of translating at the end, we set rules for every string and tested layouts in other languages while designing.
Trade-off: Labels became shorter and plainer than a copywriter might choose, and every string needed review in context. In return, no screen had to be redrawn for a market, and one set of components carried all nine languages.
The nine languages in the MVP:
English · Spanish · German · Dutch · Finnish · French · Greek · Portuguese (incl. Brazil) · Chinese
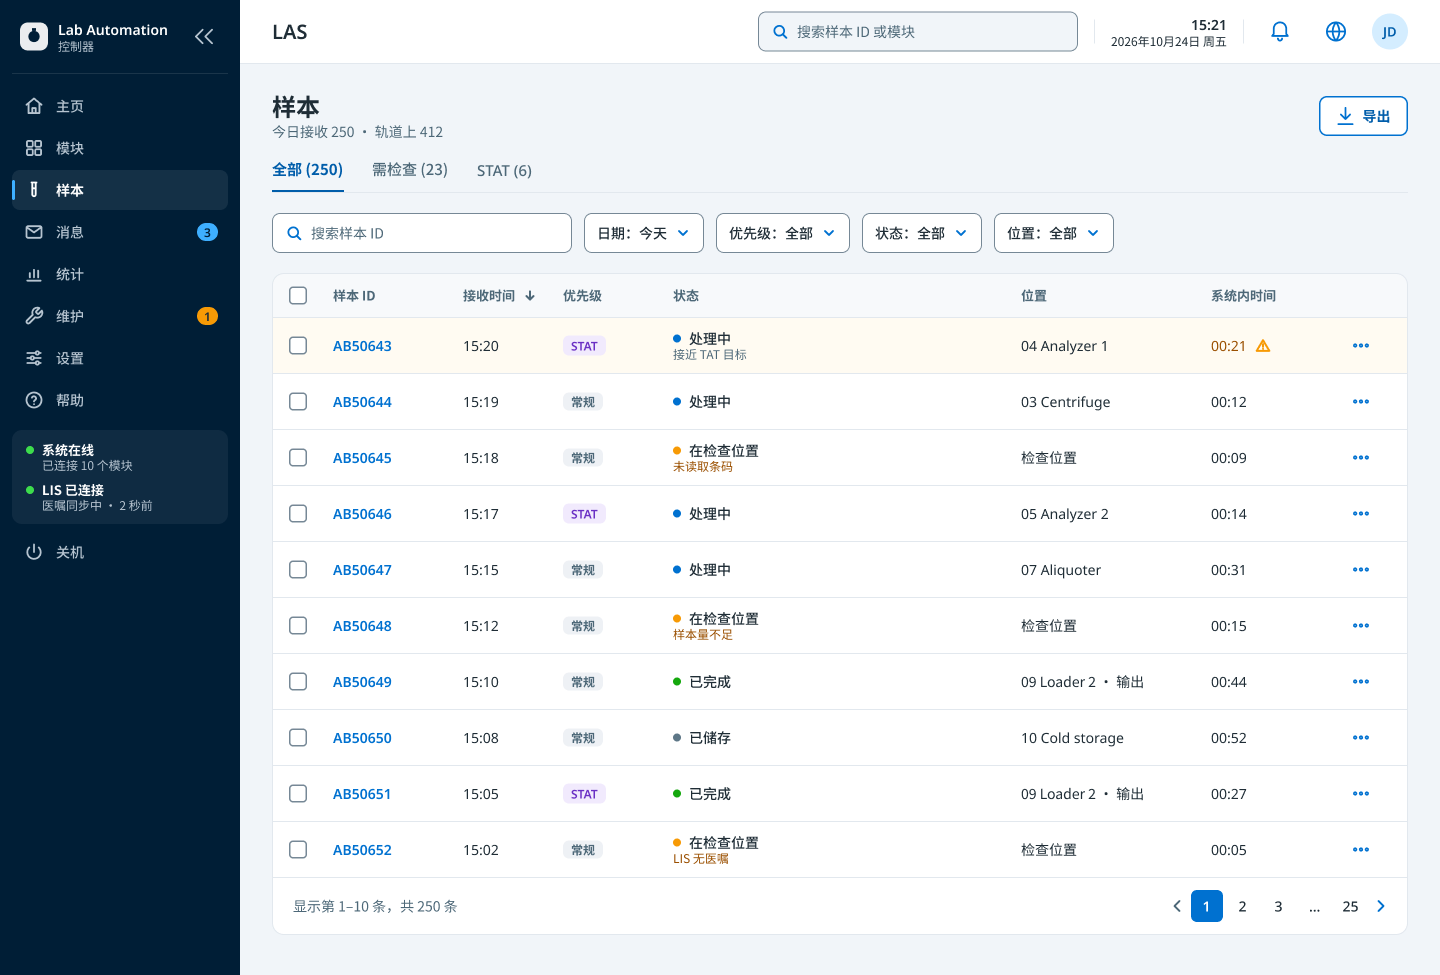
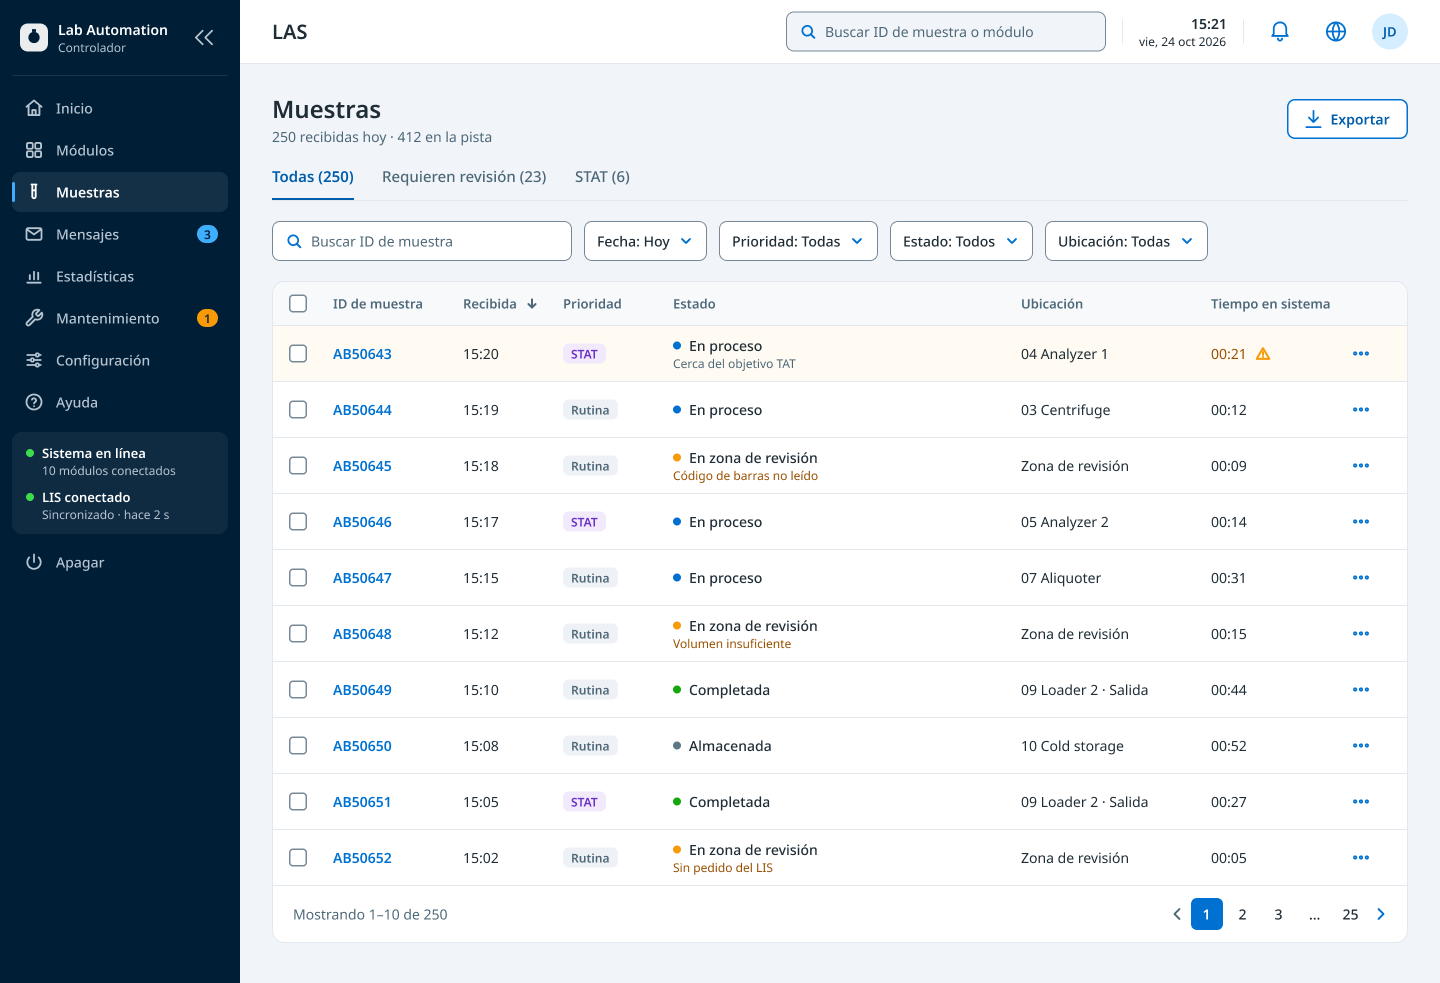
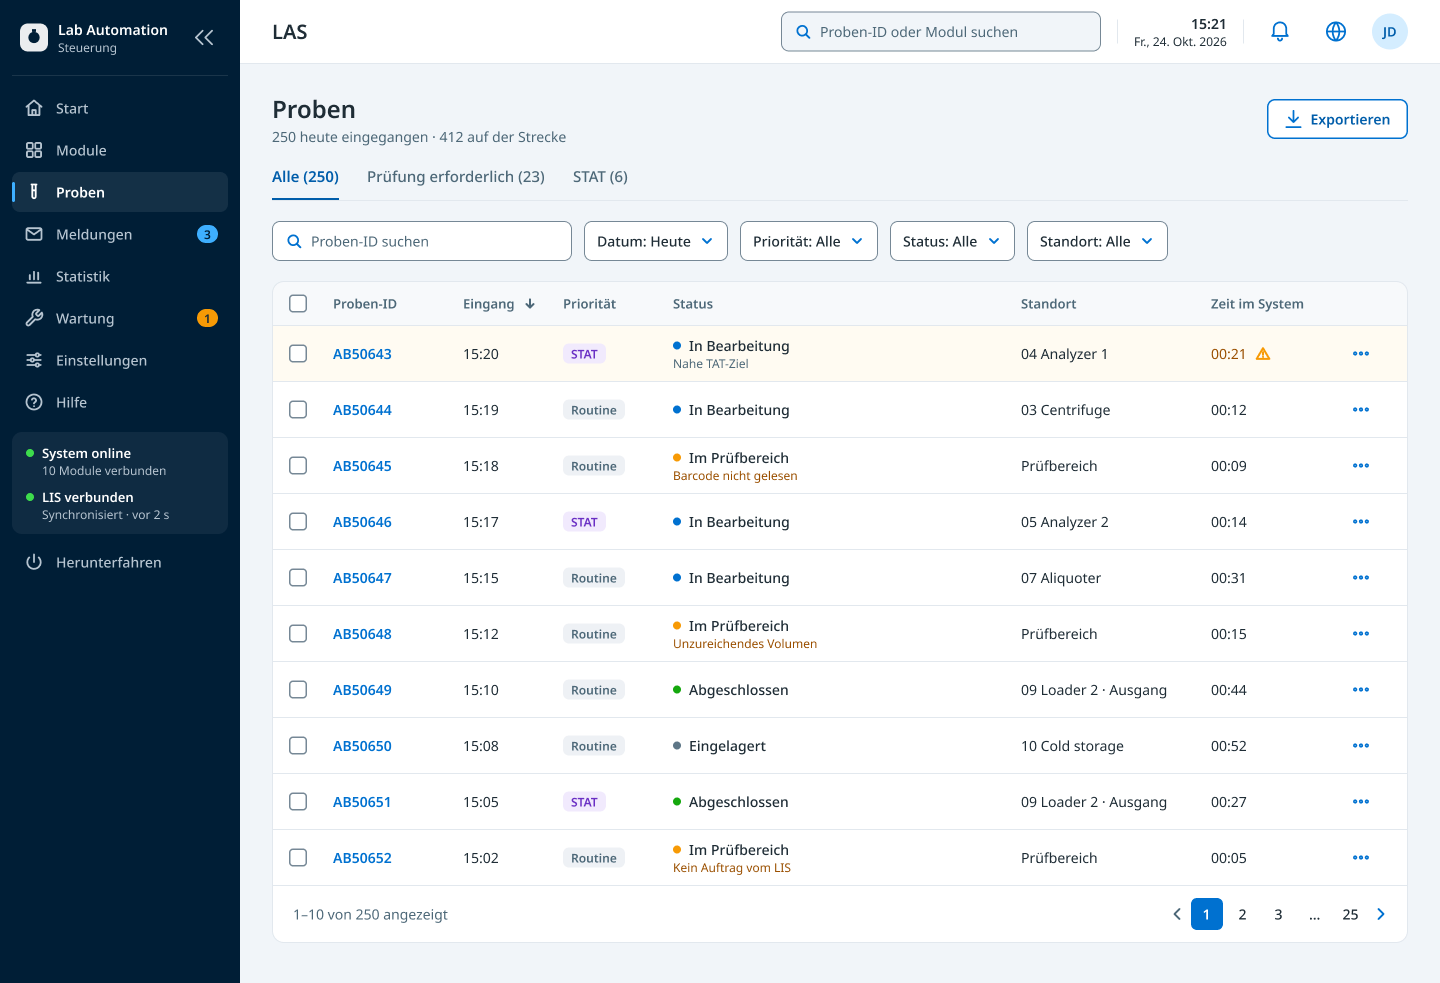
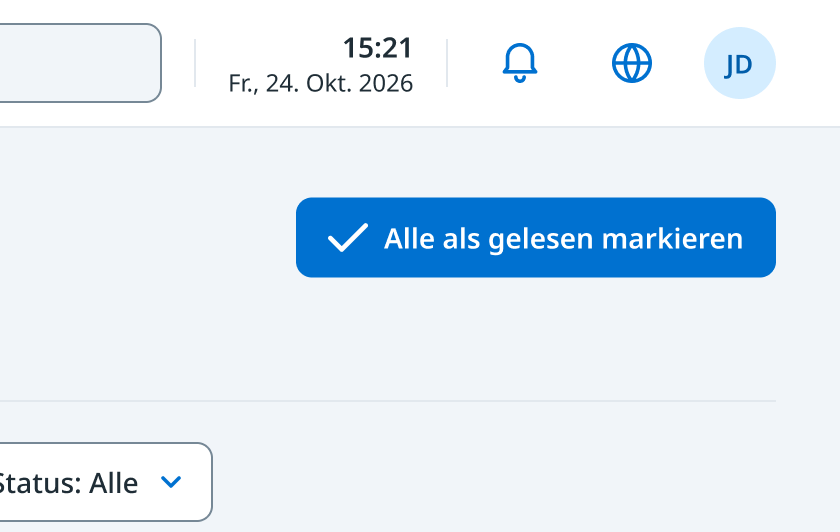
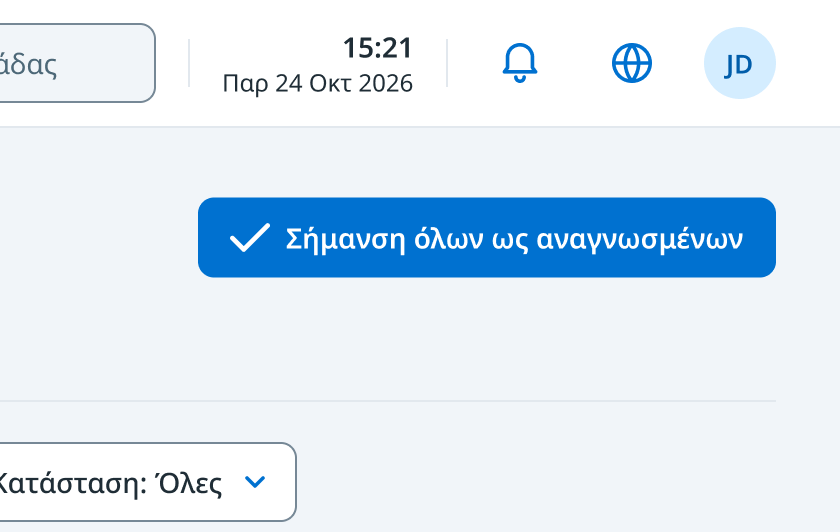

We set four rules for every string:
Decide what stays untranslated
Module names and IDs, such as 04 Analyzer 1, read the same in every language.
Write short, plain engineering English
Short source text stays short in translation. We used established terms like STAT over longer phrases like “Priority samples”.
Check every string in context
Some words shift meaning in translation. In German, “Clear” and “Delete” often both become Löschen, so “Clear messages” could read as deleting them for good.
Leave room for text to grow
We allowed for text 30–40% longer than English, more for short labels, and tested layouts in other languages while designing.
Outcome
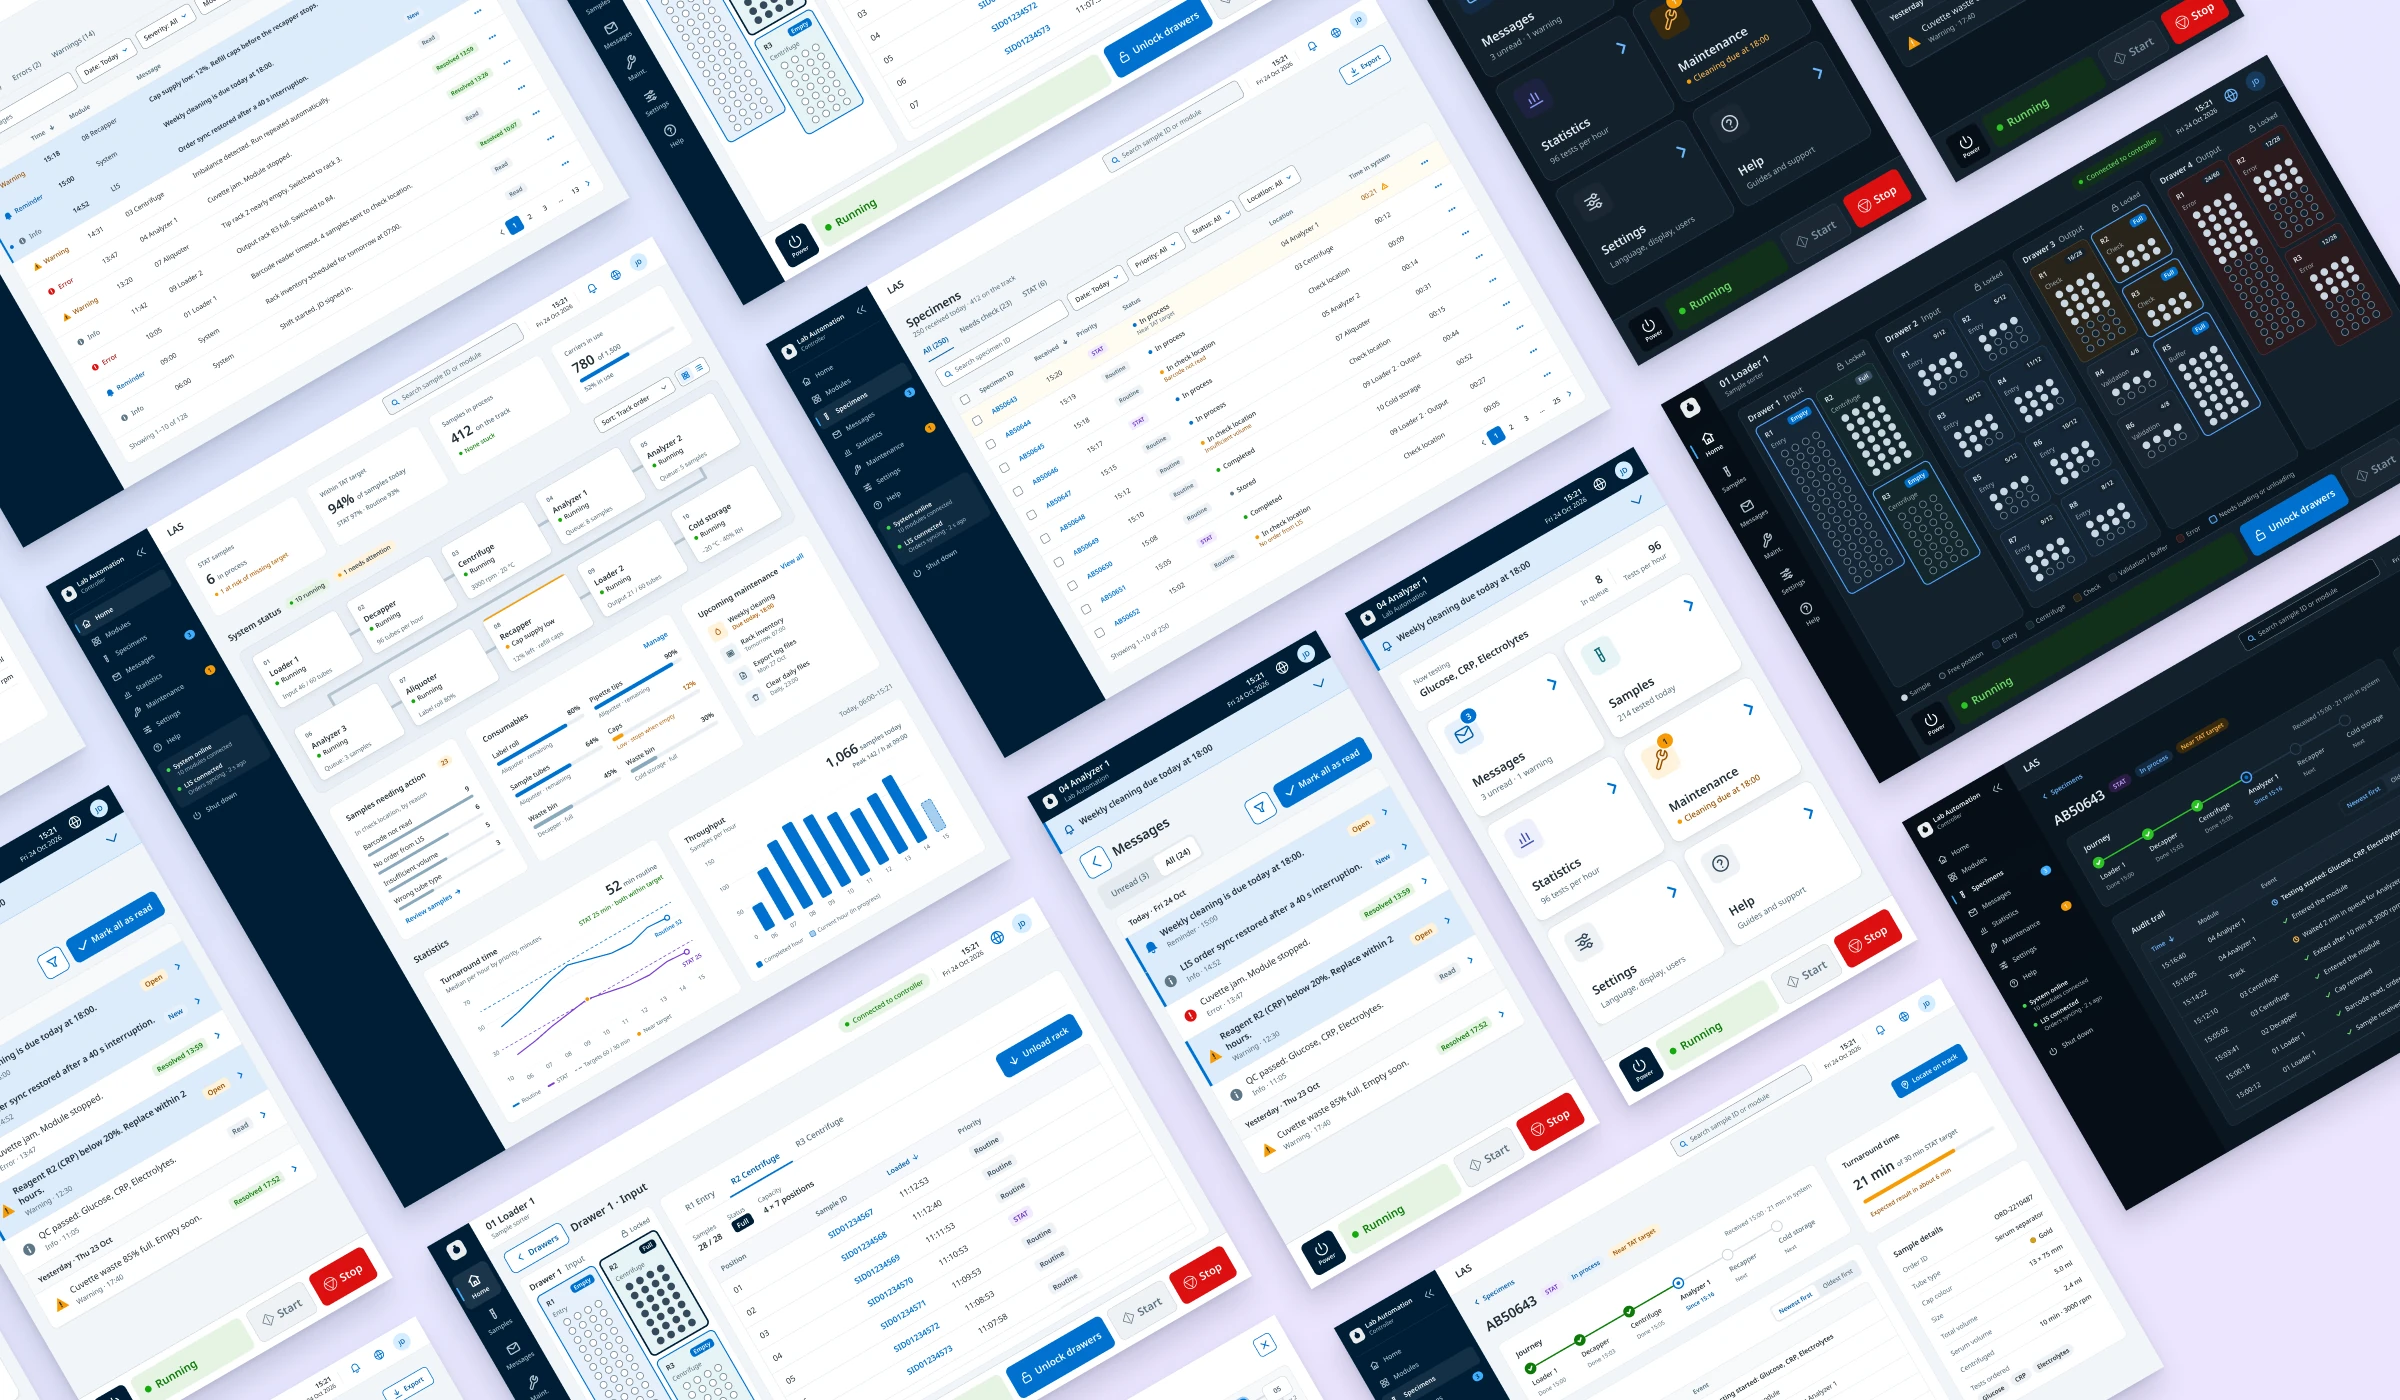
The MVP delivered a prioritised roadmap and eight applications. These were the controller and the service and maintenance tool on desktop, and six module displays, all built on one design system.
The programme was stopped before launch, after the MVP had been built and tested on real equipment. The design system carried on. A second programme adopted it for its analysers, where I also designed the analyser controller. That analyser family, with four models, was released in August 2026.
We tested routinely with application specialists, field service engineers and lab staff inside the company, at least once a quarter, in person in our prototype lab with real equipment. Each round was a task-based usability test. Users completed the highest-priority tasks, such as sending a sample for checking, reading a message and opening a drawer, and thought aloud while we watched for task success, errors and hesitation. A short interview or questionnaire followed, depending on how complex the task was.
Most rounds used the system in development. For quick decisions we tested Figma prototypes, and we A/B tested some screens to compare options.
A direct comparison with the old software was not fair, because most users had used it for over ten years. They expected a learning curve, but described the new apps as modern, fast, straightforward and easier to use.
Their requests, such as sorting the audit trail both ways, were reviewed with engineering. Crucial or low-effort fixes went into the MVP, and the rest went onto the roadmap.
Every application supported nine languages. Each was tested on physical tracks, modules and, in some cases, third-party analysers, with every feature and bug fix tested as it was built.
Reflection
The most important design work happened before anything was drawn: deciding what not to build yet, and aligning teams around it. That focus let a small team build a stable core, and the design system and information hierarchy gave every later feature a foundation.
With more time, I would validate end to end across the controller and module displays, especially during competing faults and recovery, and use what the MVP taught us to shape the mobile roadmap.